Out of Bounds: Reframing Performance Through a Comparative Analysis of Destandardized Biomechanics
September 2025 - October 2025 (6 weeks)
A data visualization project comparing Paralympic and Olympic long-jump biomechanics. Using previous research data, raw footage, and 2D/3D animation, the project reframes how diverse bodies move and perform to challenge standardized assumptions about bodies, athleticism, and sports.
Design Engineer
Role
Data Visualization Project for Design Engineering Studio Course (Yr. 1)
Context
Tools
Miro, p5.js, Cursor, Figma, Blender, AfterEffects
Cleo Pontone, Lisa (Yile) Fan
Team
Overview
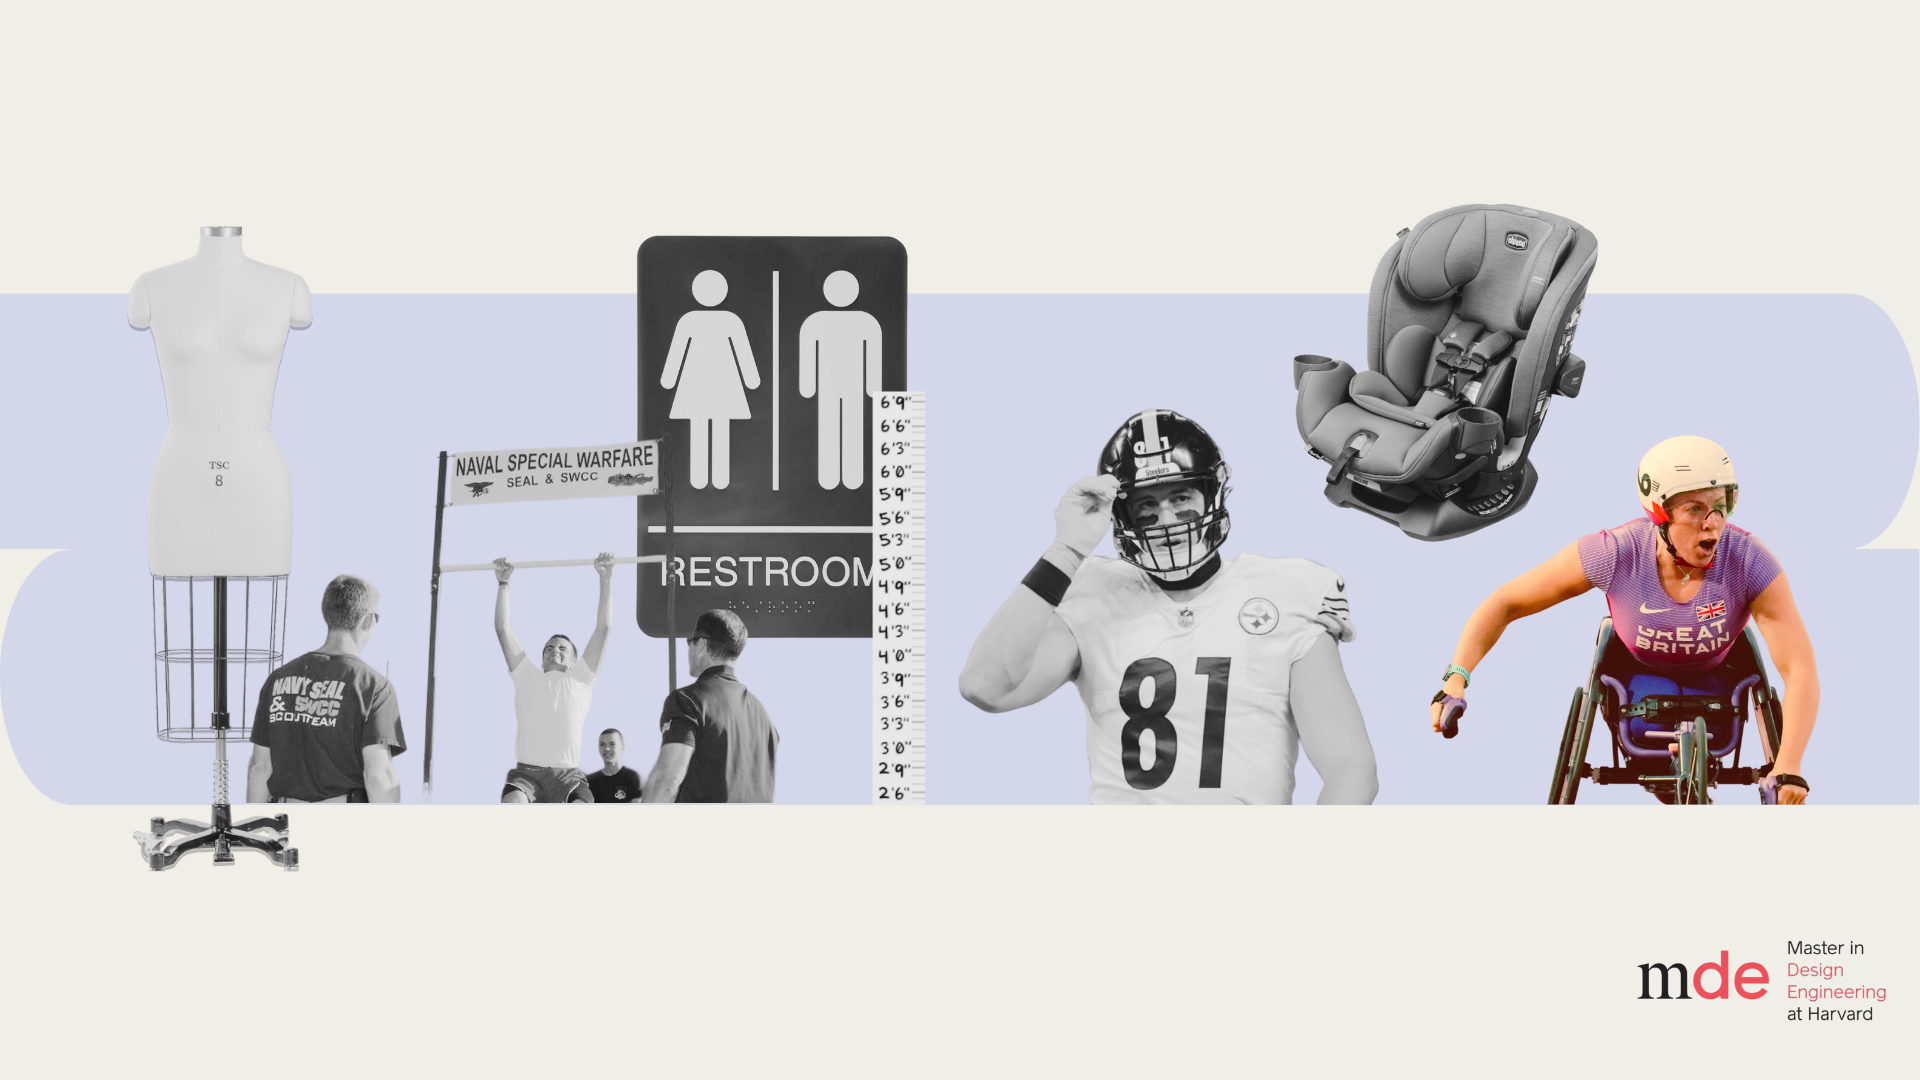
Since the beginning of time, humans have tried to discipline the body to make order out of nature. We've built systems that standardize our forms, like clothing sizes, military requirements, gender, fitness benchmarks, and minimum thresholds for safety regulation. But what happens when these standards, meant to represent everyone, exclude certain bodies?
The Paralympics first started as an empowering rehabilitation effort to help veterans suffering from spinal chord injuries reintegrate back into everyday life after returning home from WWII.
Since then 30 games have occurred, and while the Paralympics have increased global awareness about people living with disabilities, it has also exacerbated stereotypes.
Brief
Given Paralympians do not fit the idealized body, they are often posed as “superhuman” inspiration who have “overcome tragedy” or “cyborgs” that are “techno doping” rather than as elite competitors. How can we challenge this as designers?
Challenge
How can we visualize the differences (and similarities) in how diverse bodies move, perform, and achieve excellence to redefine how we view movement?
Research Question
By comparing Olympic and Paralympic long-jumpers’ movement, we investigate how diverse bodies perform beyond the limits of a standardized ideal. In visualizing these differences and common biomechanics, we seek to expand how movement and bodies are recognized and considered across not just sports, but also policy, design, and cultural narratives in the future.
Final Product
Approach
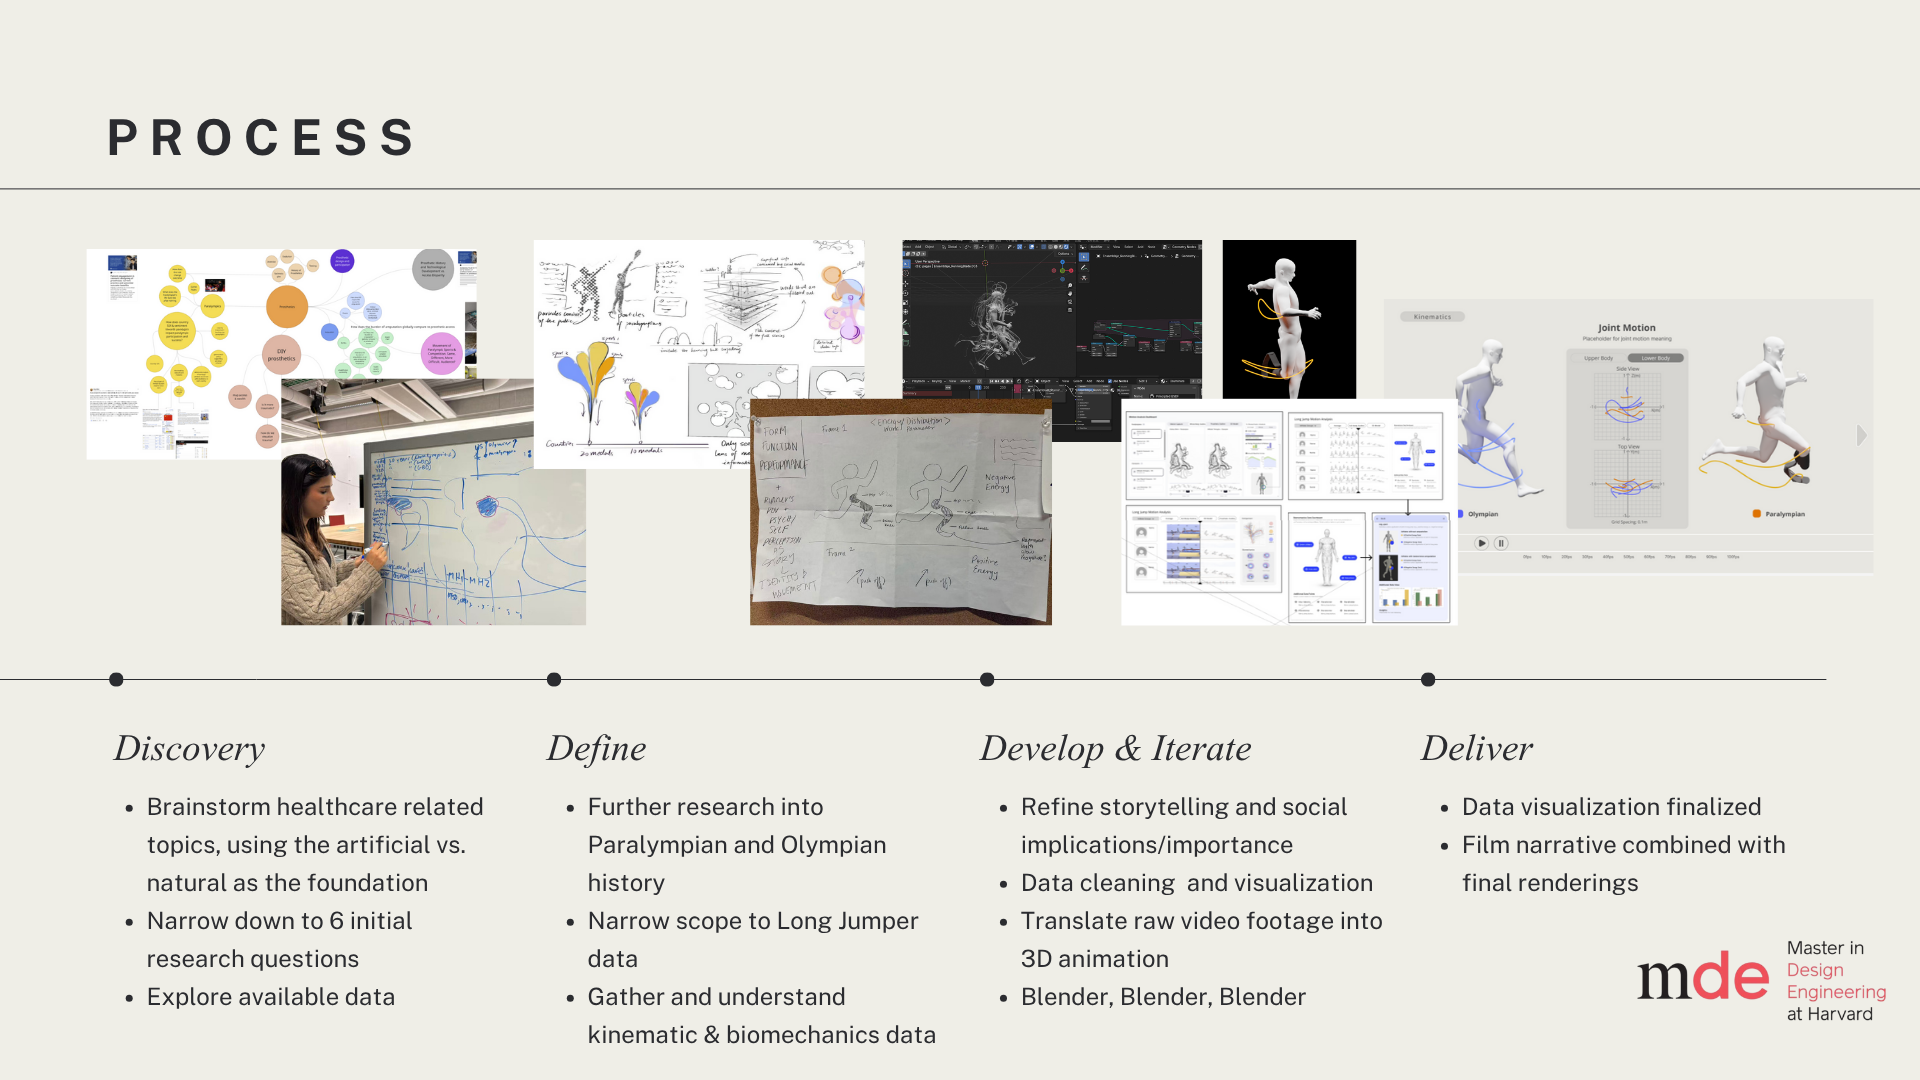
Discovery
Brainstorm healthcare related topics, using the artificial vs. natural as the foundation
Narrow down to 6 initial research questions
Explore available data
Define
Further research into Paralympian and Olympian history
Narrow scope to long jumper data
Gather and understand kinematic & biomechanics data
Develop & Iterate
Refine storytelling and social implications/importance
Data cleaning
Translate raw video footage into 2D and 3D animation
Blender, Blender, Blender
Deliver
Data visualization finalized
Film narrative combined with final renderings
Discovery
For my first studio project within Harvard’s Master’s in Design Engineering program, we were tasked with creating a data visualization that connects this year’s selected studio theme, “Artificial vs. Natural.” While the prompt was very open-ended, we received guidance that the visualization should be based on more than one, if not several, datasets and provide a new perspective to an issue or area of research. Given the timeframe (<6 weeks), the datasets should already exist or be producible within 2 weeks.
I was paired with an industrial designer by practice, Lisa Fan, with whom I shared an interest in health tech. We spent ~1 week doing divergent research in this area to ensure we selected the most compelling topic that was also achievable with the known data and time constraints.
A few explored topics include:
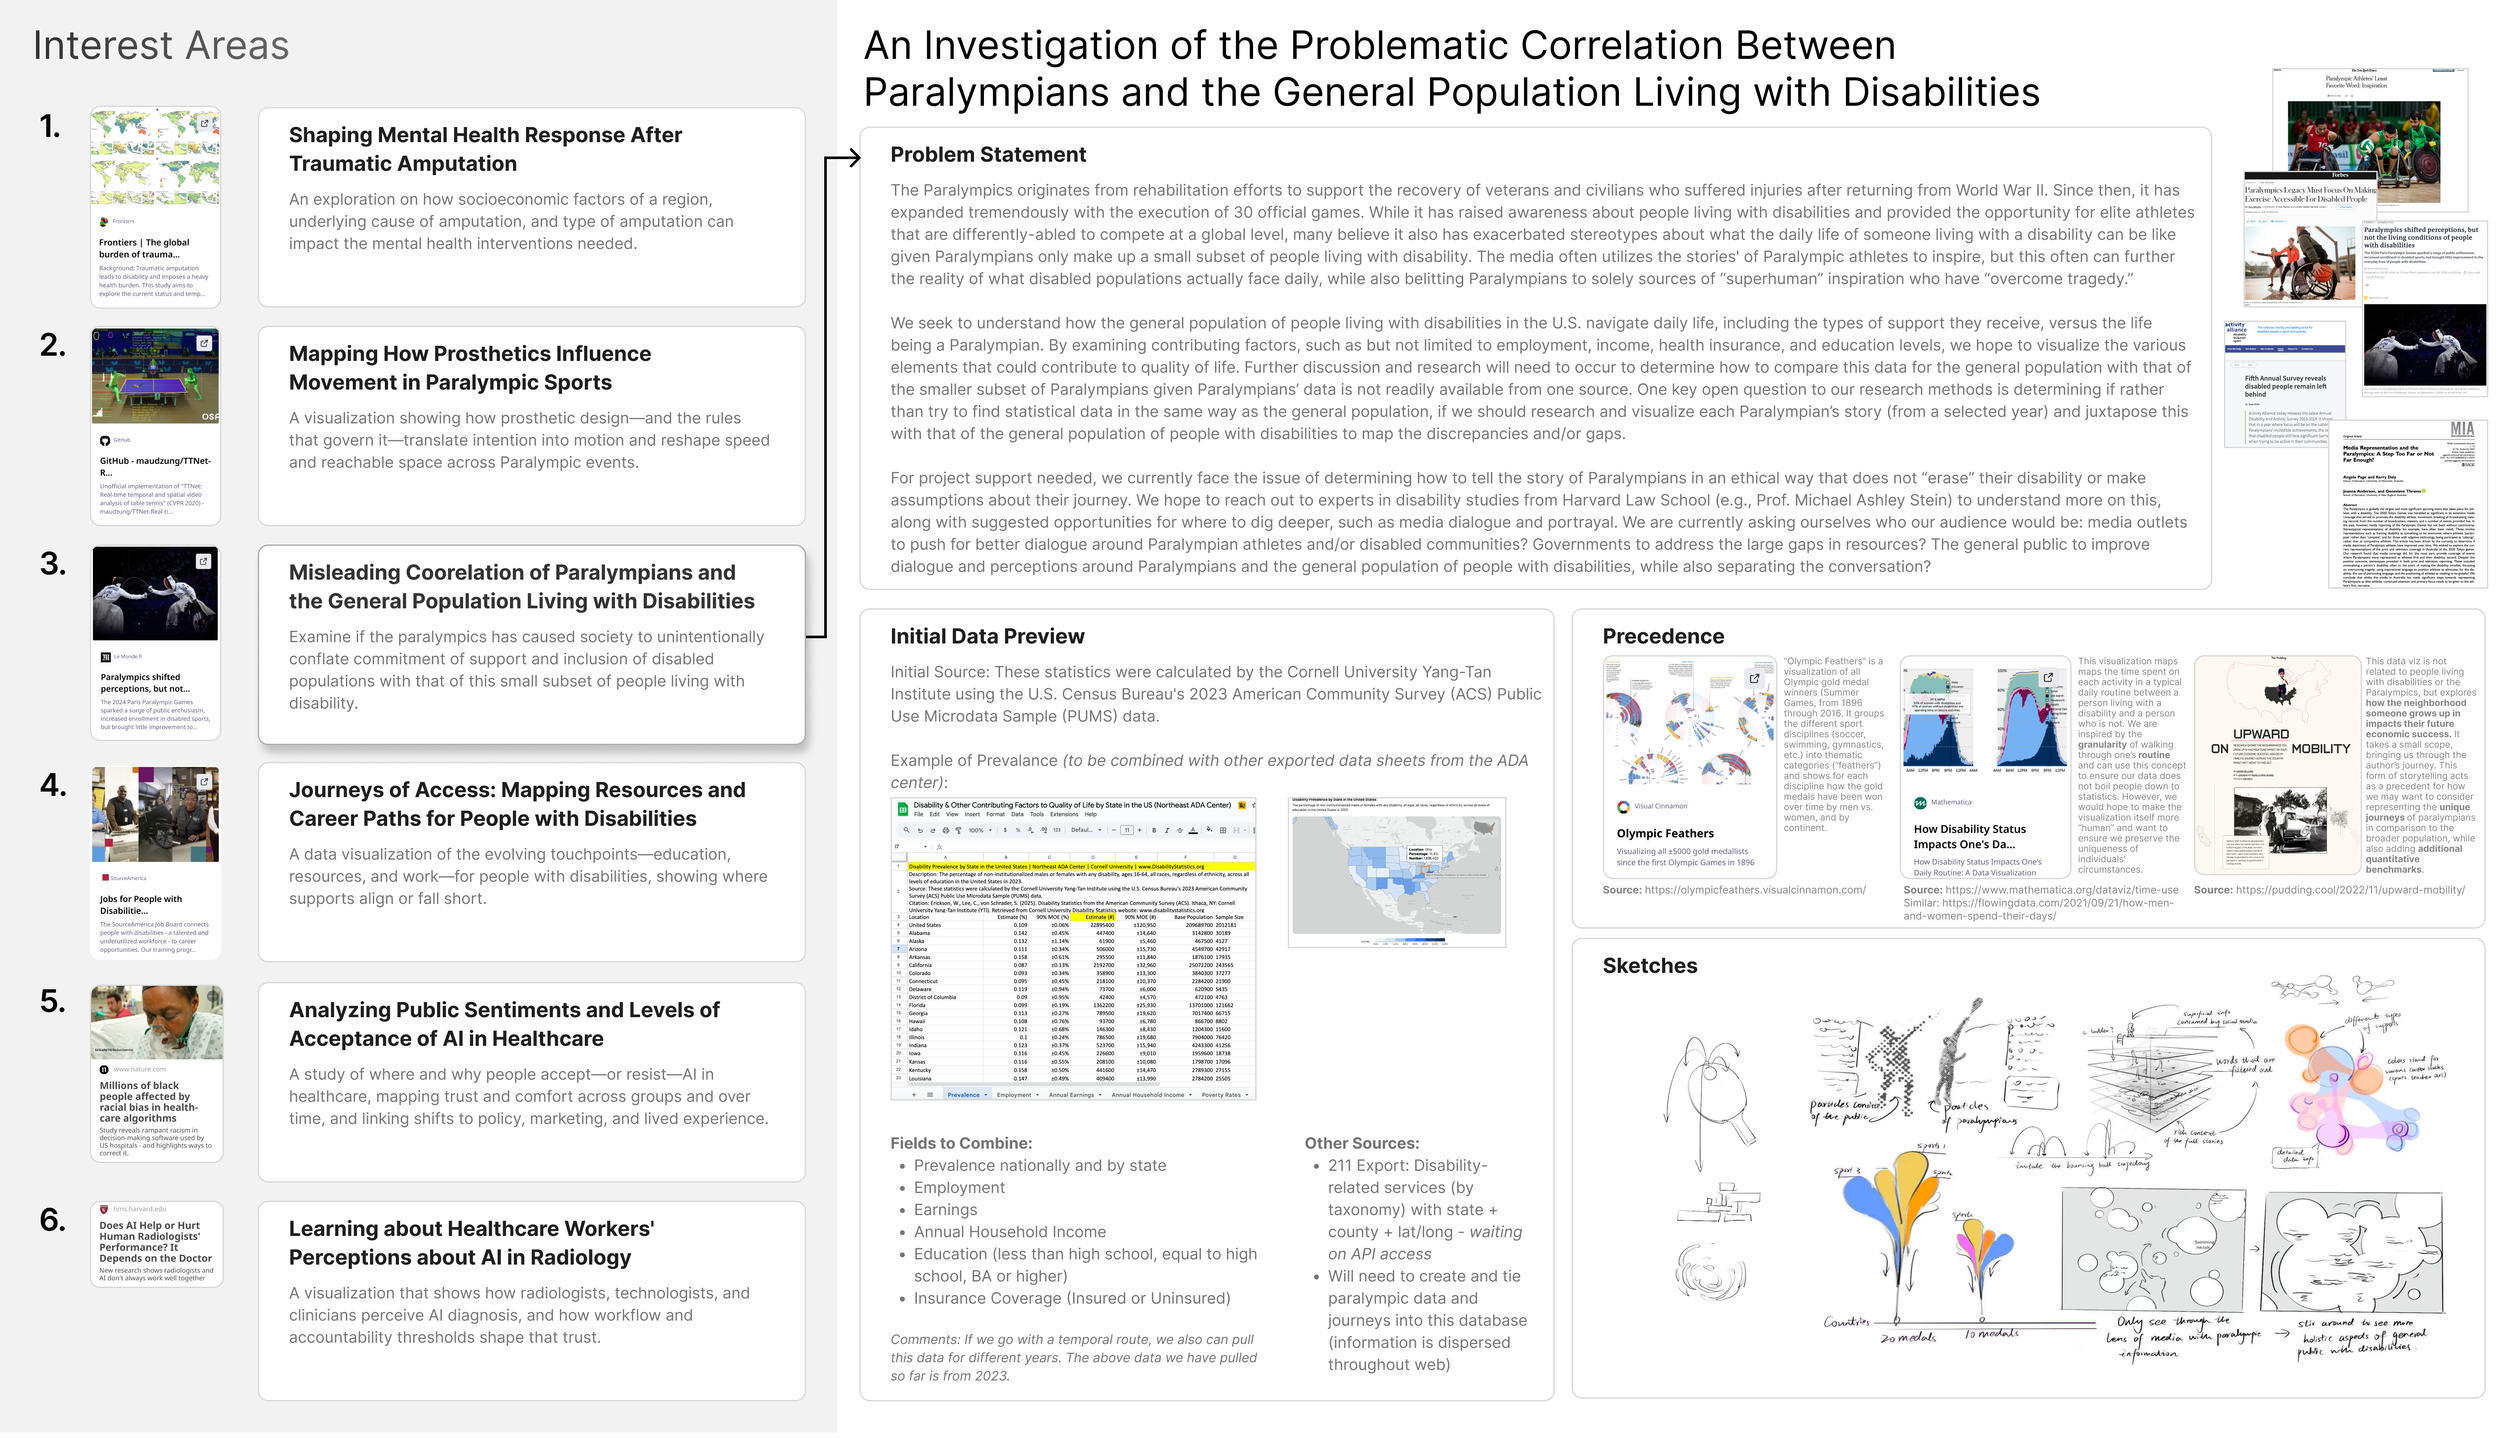
Mental Health and Traumatic Amputation: An exploration on how socioeconomic factors of a region, underlying cause of amputation, and type of amputation can impact the mental health interventions needed.
Analyzing Public Sentiments and Levels of Acceptance of AI in Healthcare: A study of where and why people accept, or resist, AI in healthcare, mapping trust and comfort across groups and over time, and linking shifts to policy, marketing, and people’s experience.
Learning about Healthcare Workers' Perceptions about AI in Radiology: An exploration into how radiologists, technologists, and clinicians perceive AI diagnosis, and how workflow and accountability mold that trust.
Problem Exploration
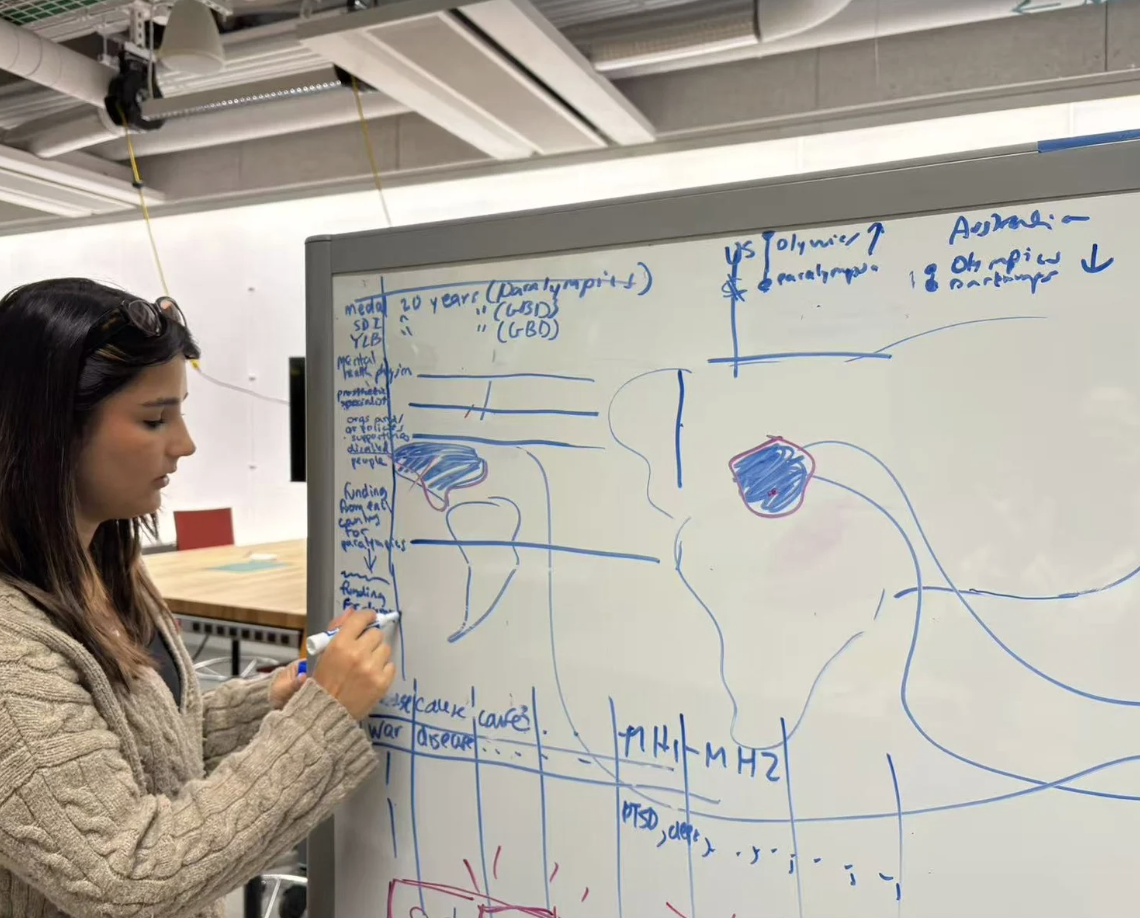
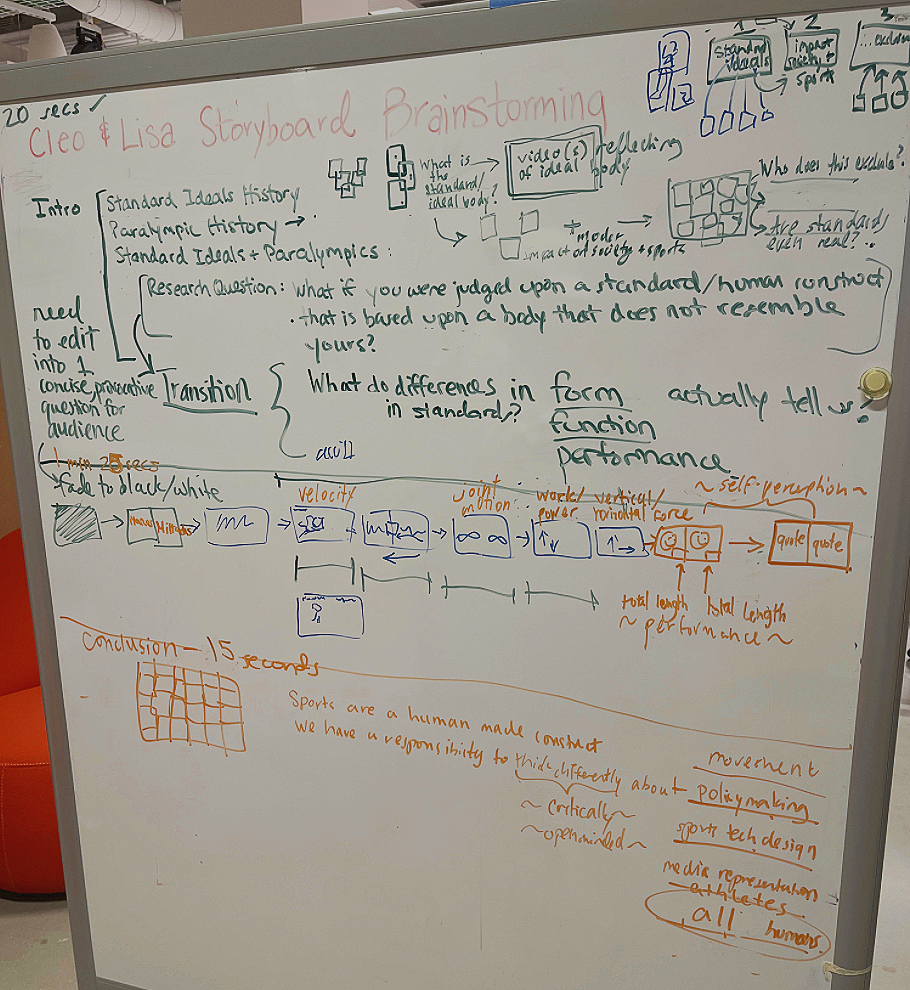
Brainstorming Potential Concepts
Class Pin-up of Our Early Research Areas & Proposed Selection
Define
Among these themes, prosthetics repeatedly surfaced as a compelling intersection of design, health tech, and lived experience. Looking at how prosthetic users navigate the world revealed disparities in mobility, stigma, and quality of life. Because people who use prosthetics fall outside the “standard” body, they continue to face persistent biases, including unequal compensation, misleading or belittling media representation, and limited cultural understanding of their movement.
This path eventually led us to Paralympians, athletes who sit as an especially complex intersection. Despite being elite performers, they still encounter many of the same societal biases, both similar and unique to non-athlete prosthetic users, simply because their bodies and movements do not align with the traditional notion of a “standard” body.
This raised many questions:
Given they are elite athletes, why does media bias persist?
Why are they compensated less for achievements in the same events as Olympians?
How is their movement actually different compared to Olympians?
And most fundamentally, what even is a standard body?
The flood of open questions signaled a rich problem space worth exploring for a data visualization.
Ideation
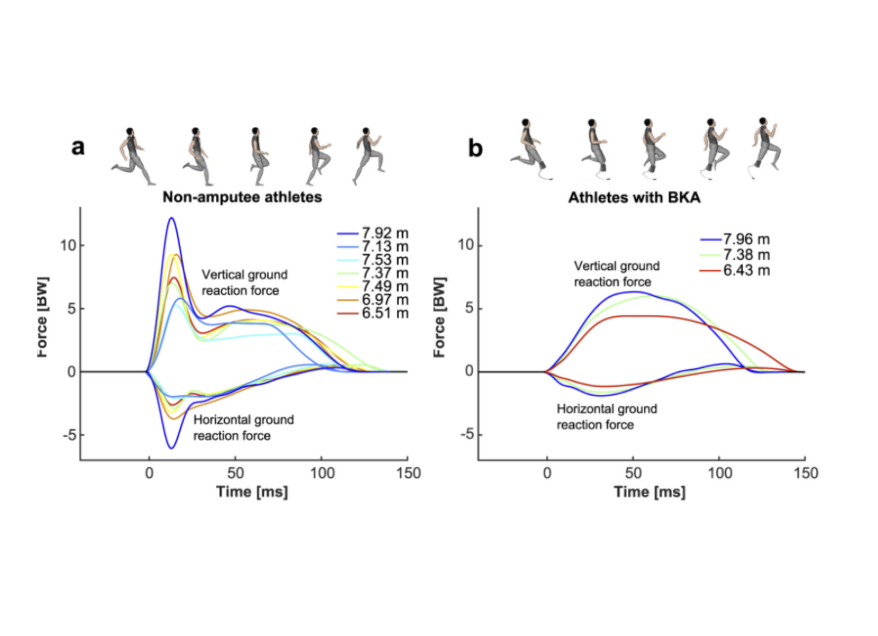
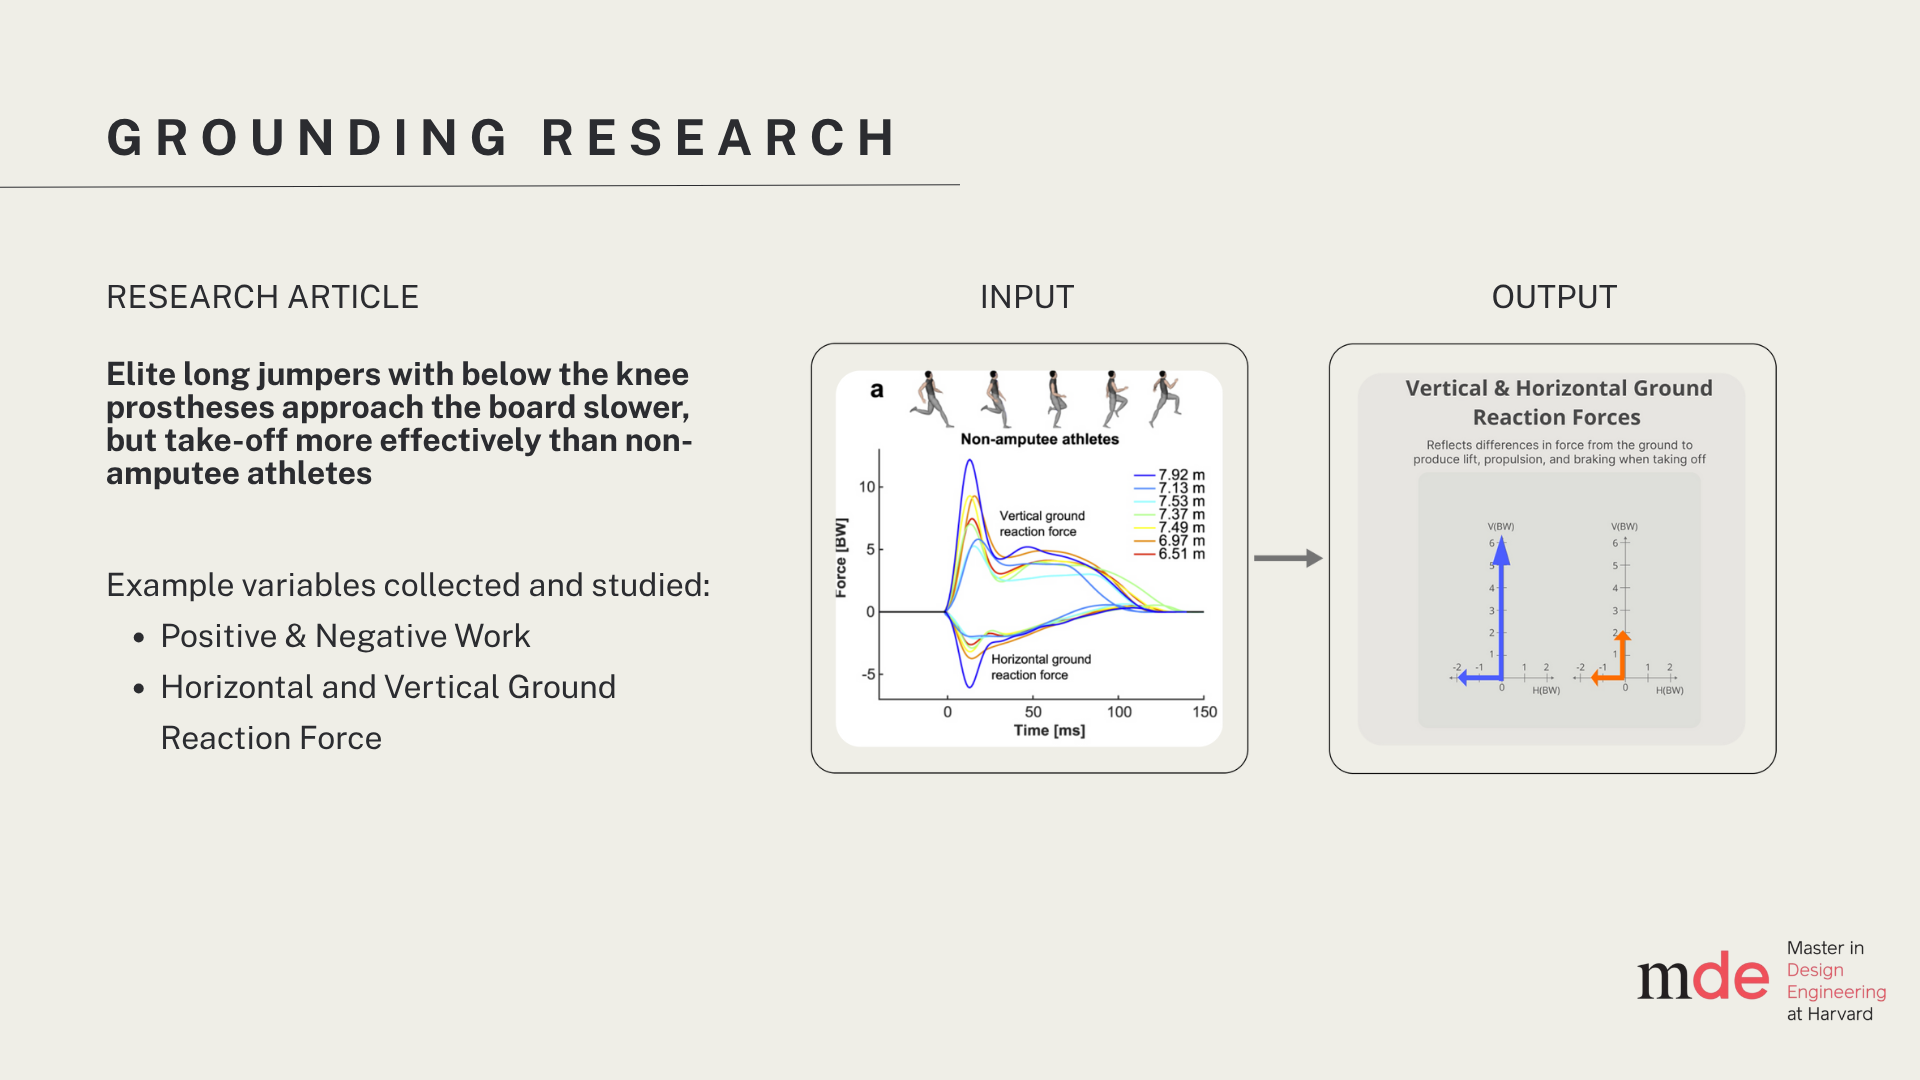
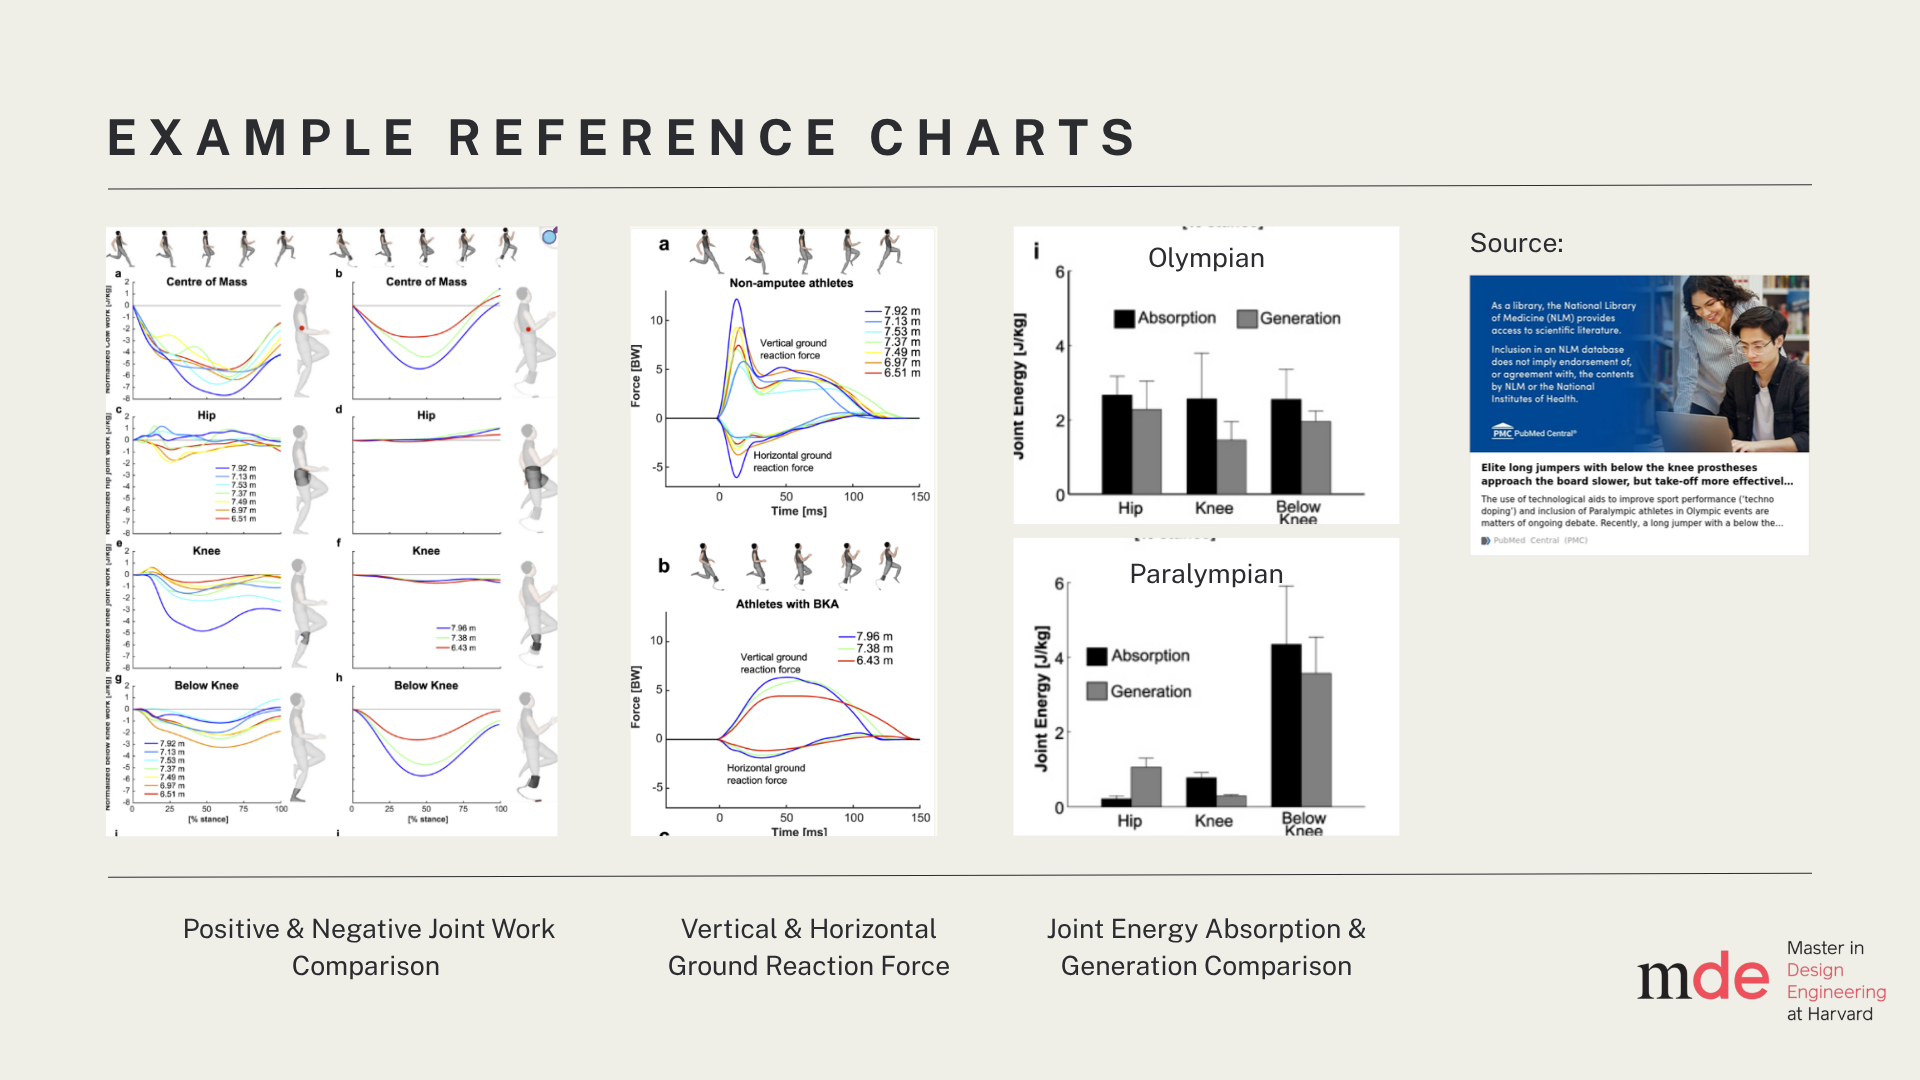
While digging deeper into these open questions, we found a biomechanics study comparing the world’s top Olympic and Paralympic long-jumpers: “Elite long jumpers with below the knee prostheses approach the board slower, but take-off more effectively than non-amputee athletes.” This research analyzed joint energy, force profiles, and stride mechanics across both groups.
Our team was inspired by some of the results the research provided, including:
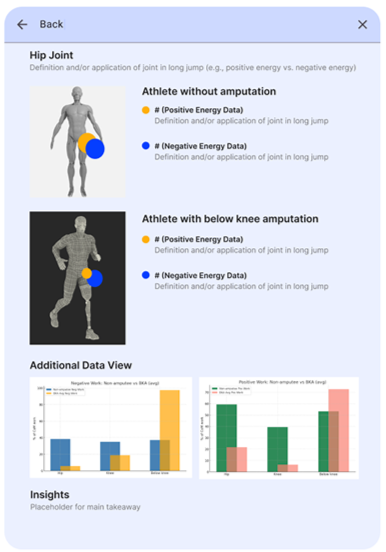
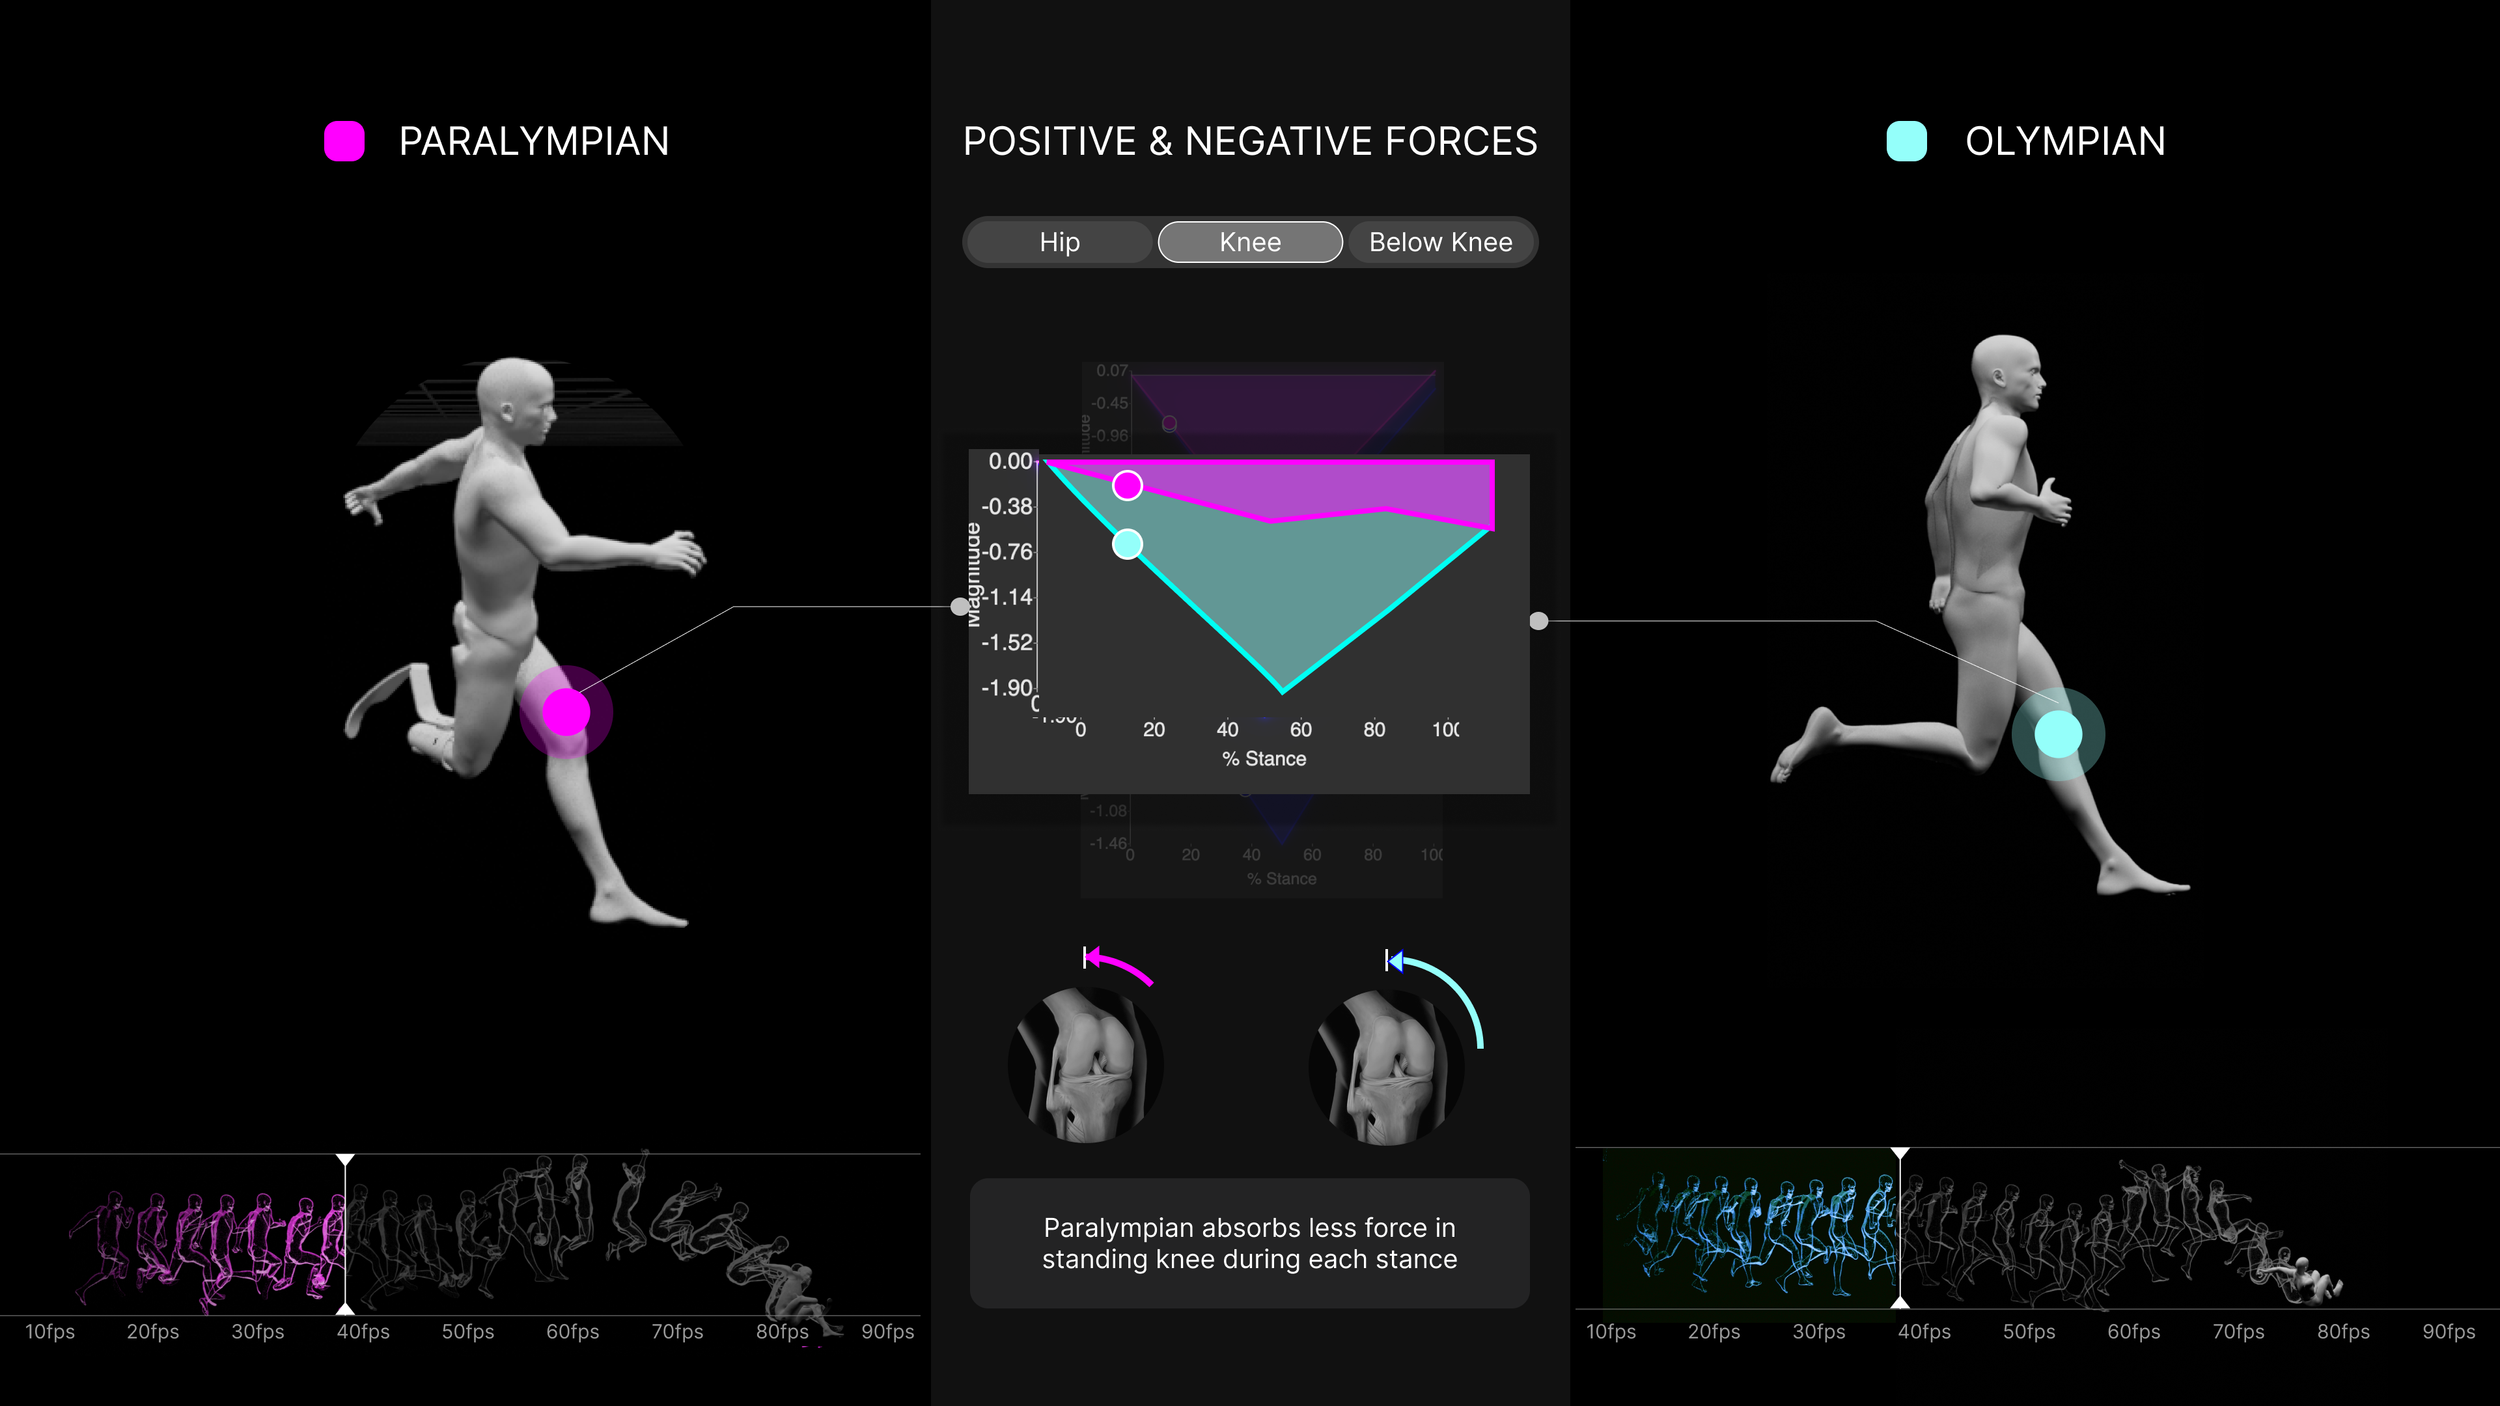
Energy distribution differences: Non-amputee athletes absorbed and generated energy more evenly across joints, whereas athletes with below-the-knee amputations showed concentrated energy patterns during takeoff, including higher amounts in their hip.
Approach speed disadvantages: Paralympian long-jumpers reached slower maximum sprinting speed (~7.6% slower) than non-amputees
Unique advantage in takeoff: Despite slower approaches, athletes with prostheses produced a more "mechanically effective take-off” with an estimated .13 m return, made possible by prosthetic energy return and adaptability of other joint areas
These “contradictions,” including slower speed, different energy distributon, yet equally or potentially even more affective take-off, prompted us to ask: If Paralympians can achieve equivalent outcomes through different mechanics, what does this reveal about how we define athleticism?
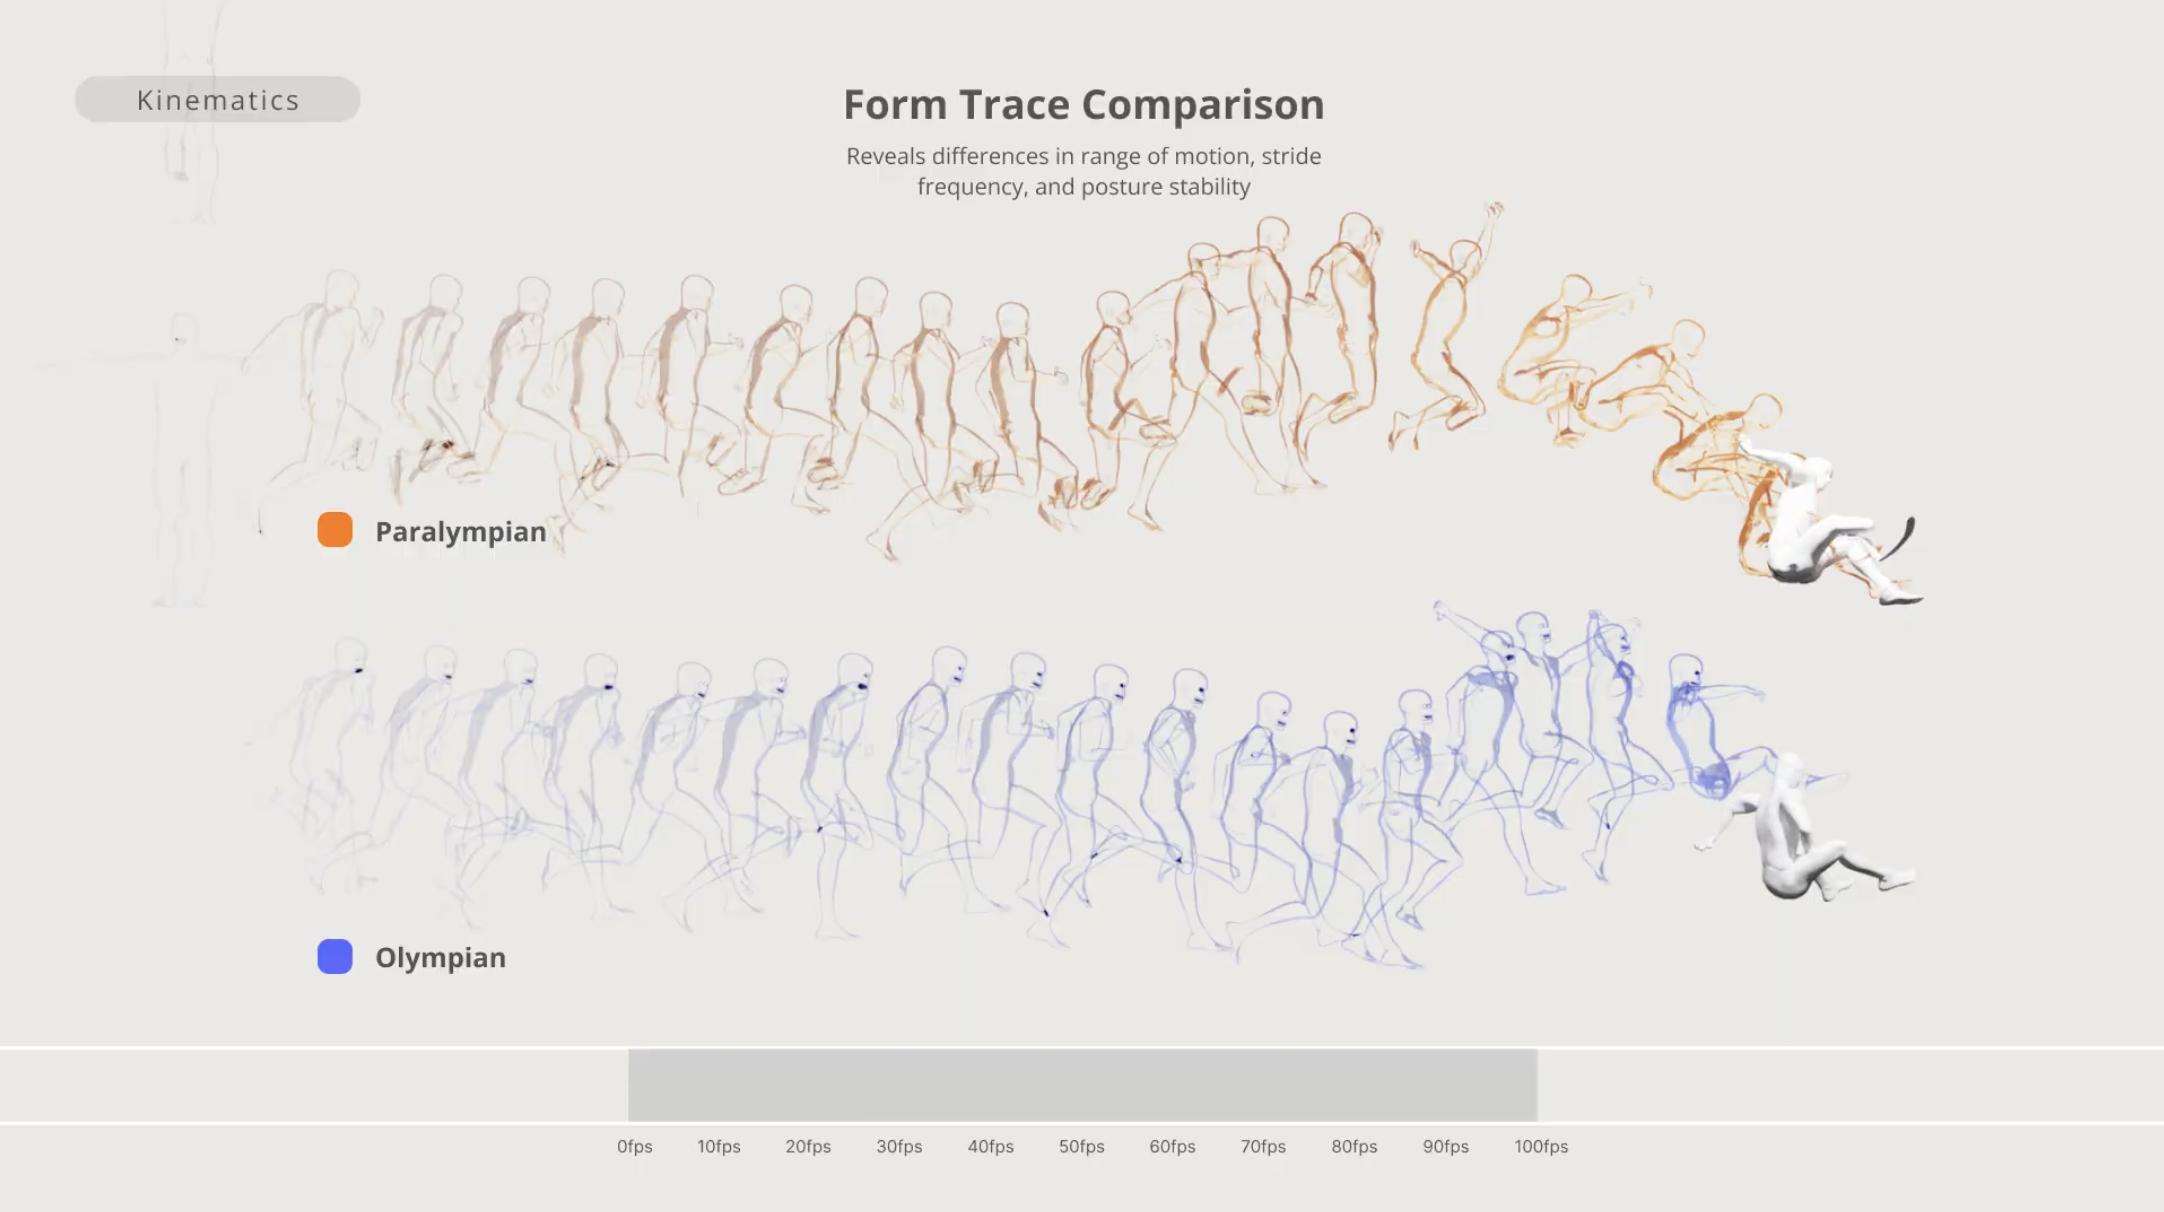
However, numerical data alone could not capture the full story we were seeing. As we reviewed extensive footage of Paralympians, we became increasingly aware of the rich diversity in the shape of movement. We decided that in order to reflect this we needed to incorporate raw footage somehow.
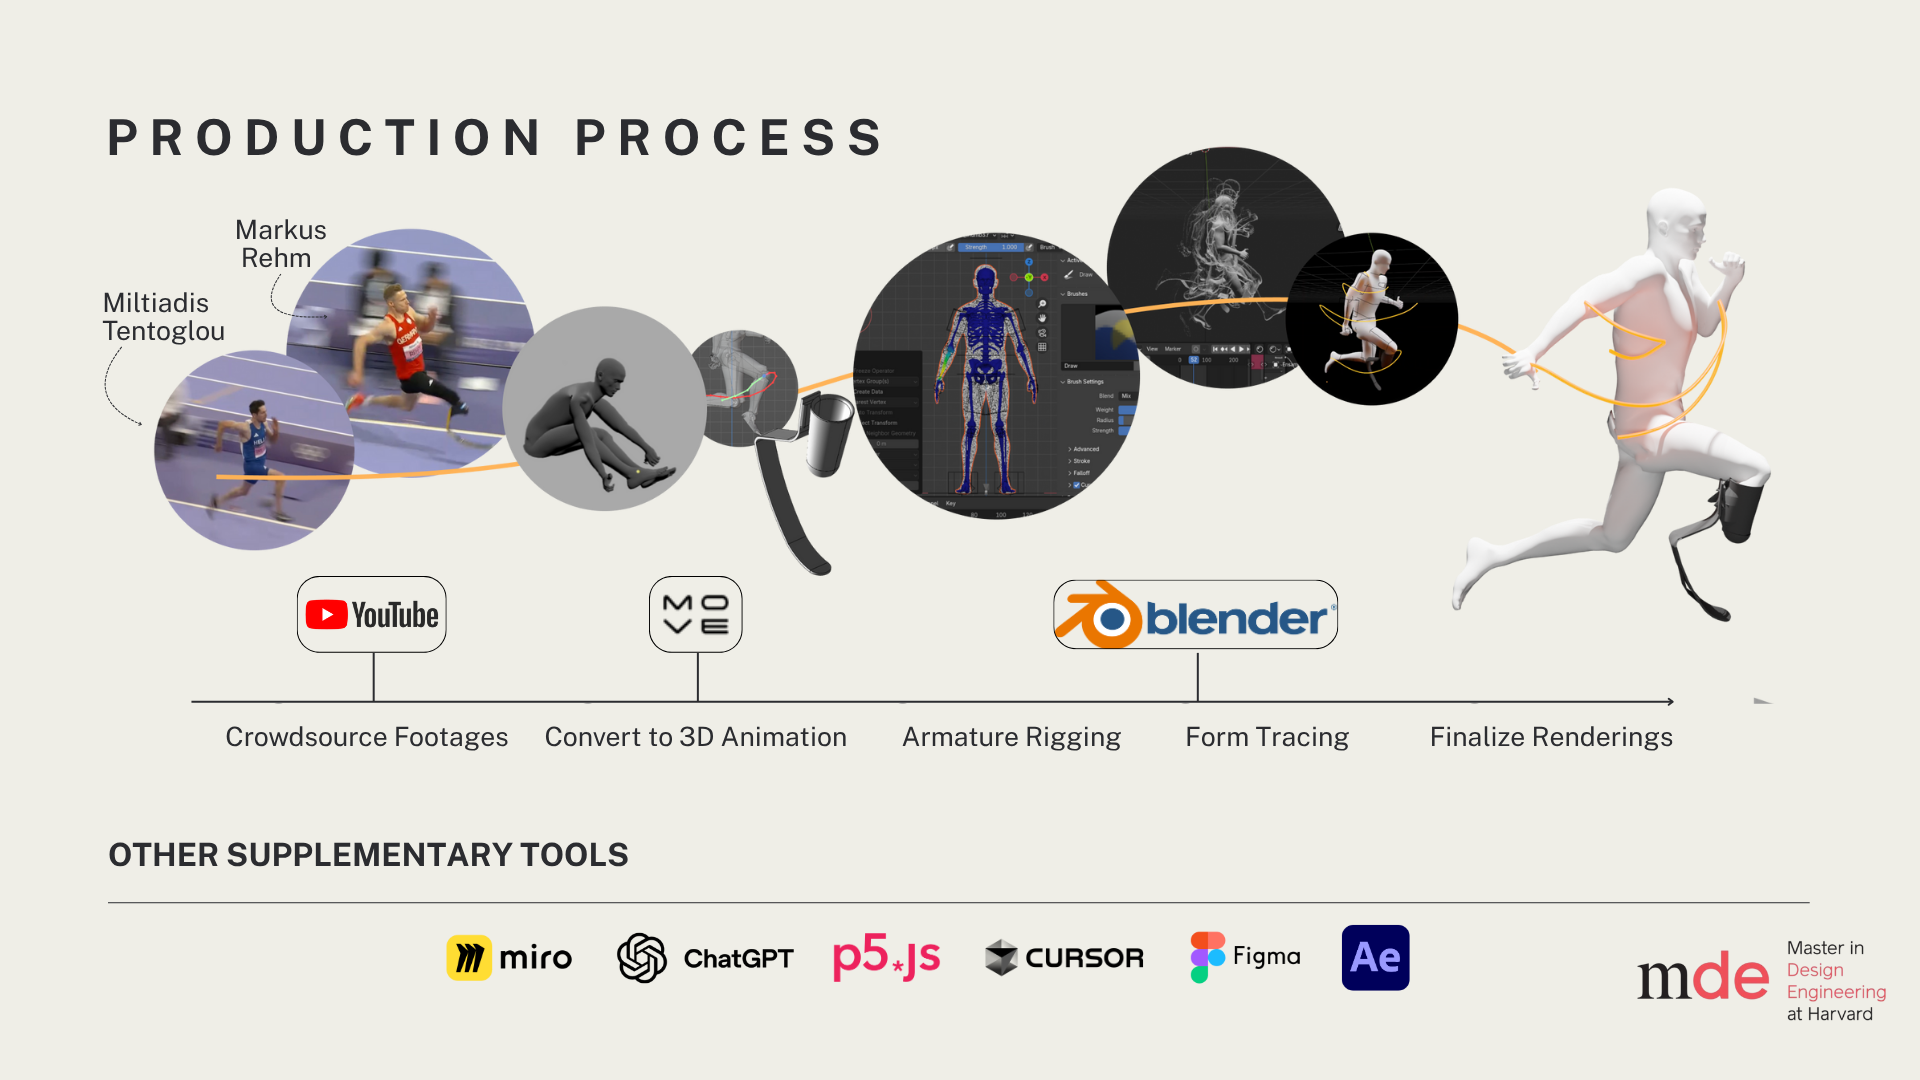
Through experimentation and ideation, we decided that we could do this in a meaningful, noninvasive way by processing crowdsourced film into 2D and 3D models, enabling us to visually isolate and compare motion across athletes.
Lastly, historical and cultural context also seemed essential from our early research. Our qualitative research helped us understand how society has defined athleticism, ability, and “normal” movement over time.
Ultimately, we were narrowed down our data sources to the following 3 buckets:
Data Exploration
Biomechanics Data
Used to understand the mechanical differences in how Olympic and Paralympic long-jumpers generate force and energy
Datasets
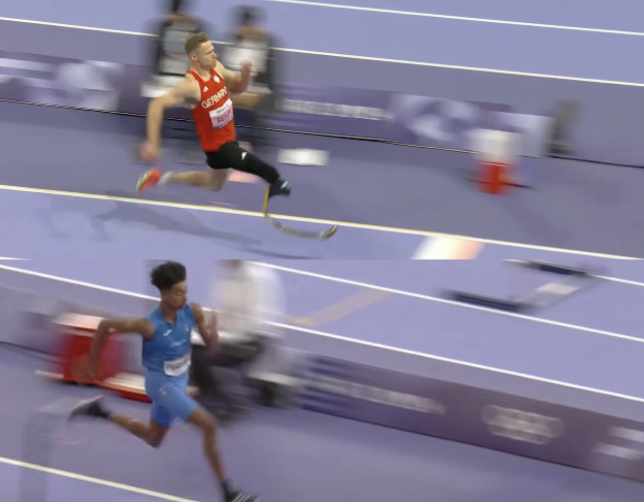
Raw Footage
Used to visualize the actual shape of movement and transform athlete motion into 2D and 3D form
Research Article (Source)
Paralympian Markus Rehm (top) & Olympian Miltiadis Tentoglou (bottom)
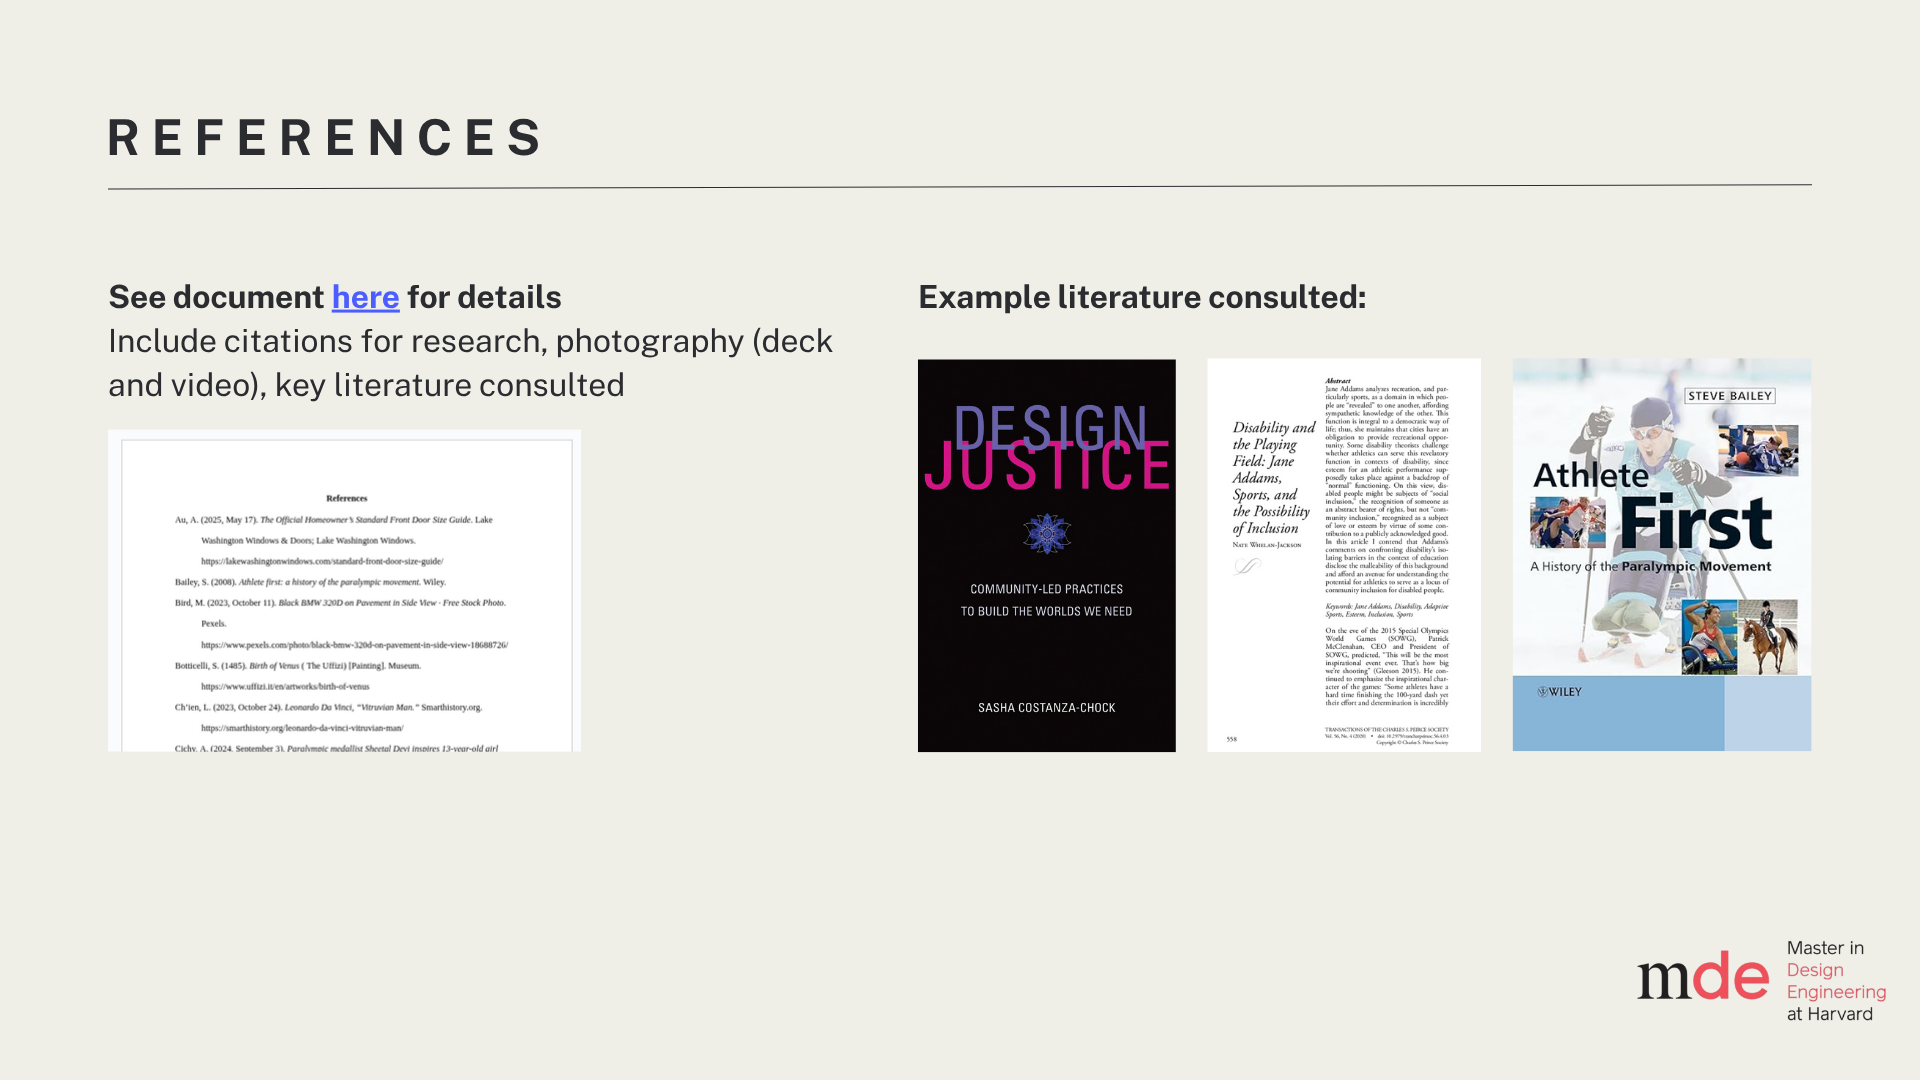
Qualitative History
Used to contextualize movement within cultural, historical, and policy frameworks
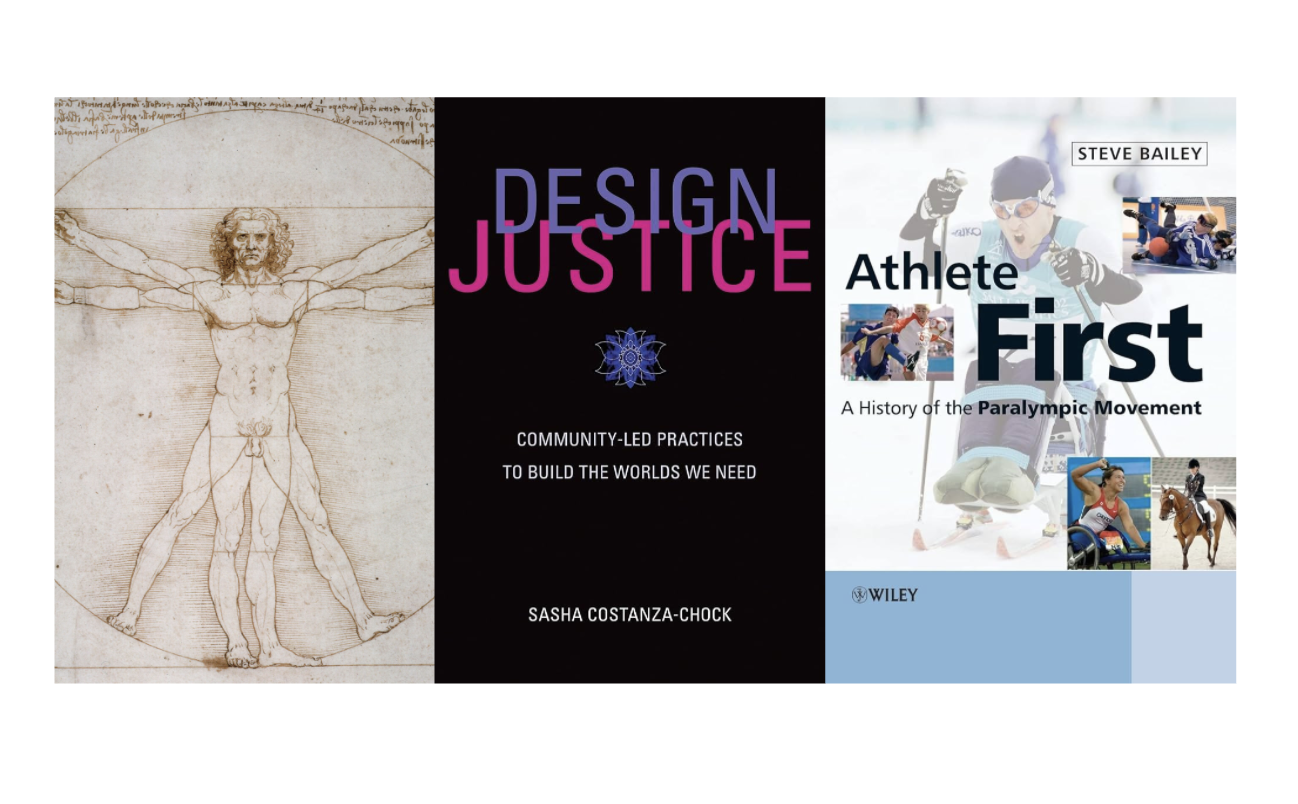
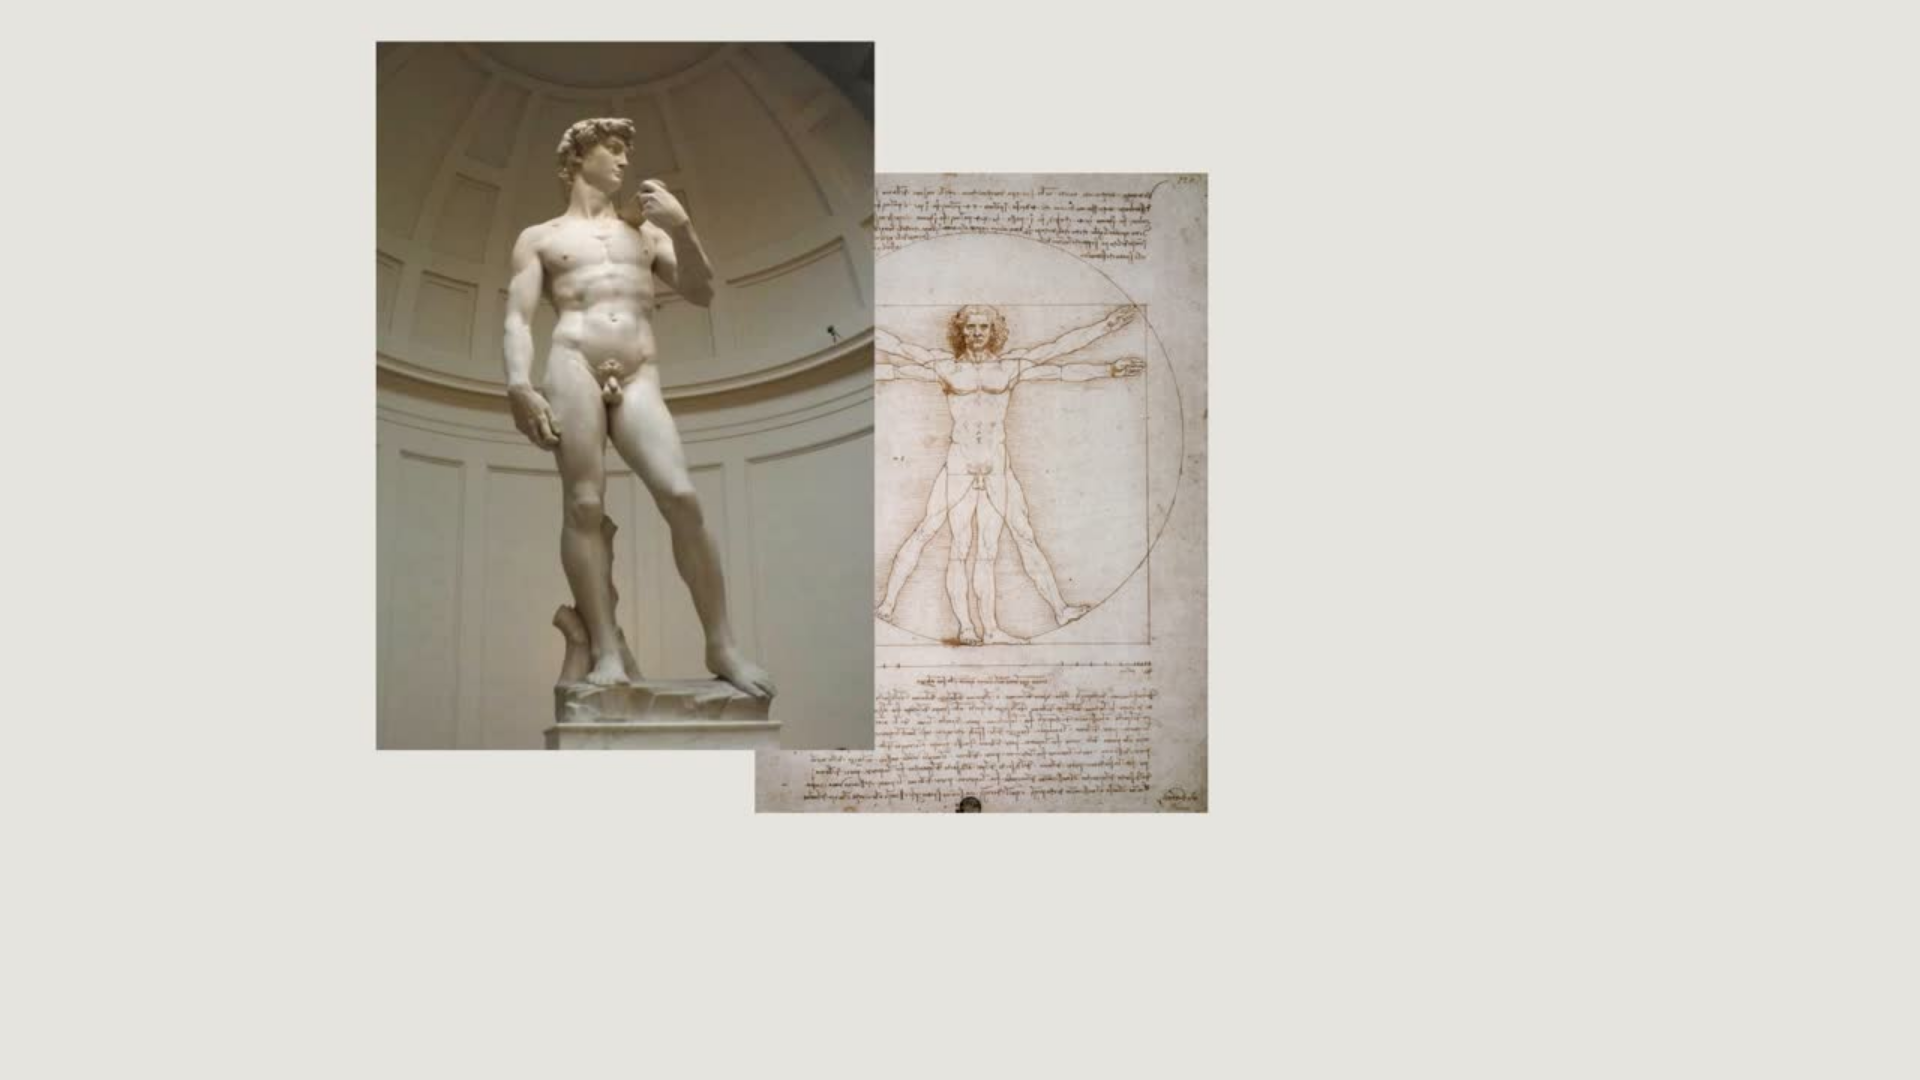
Leonardo da Vinci’s Vitruvian Man, Sasha Costanza-Chuck’s “Design Justice,” and Steve Bailey’s “Athlete First: A History of the Paralympic Movement”
By combining these 3 forms of data, we aim to tell a fuller story about our perception of human movement:
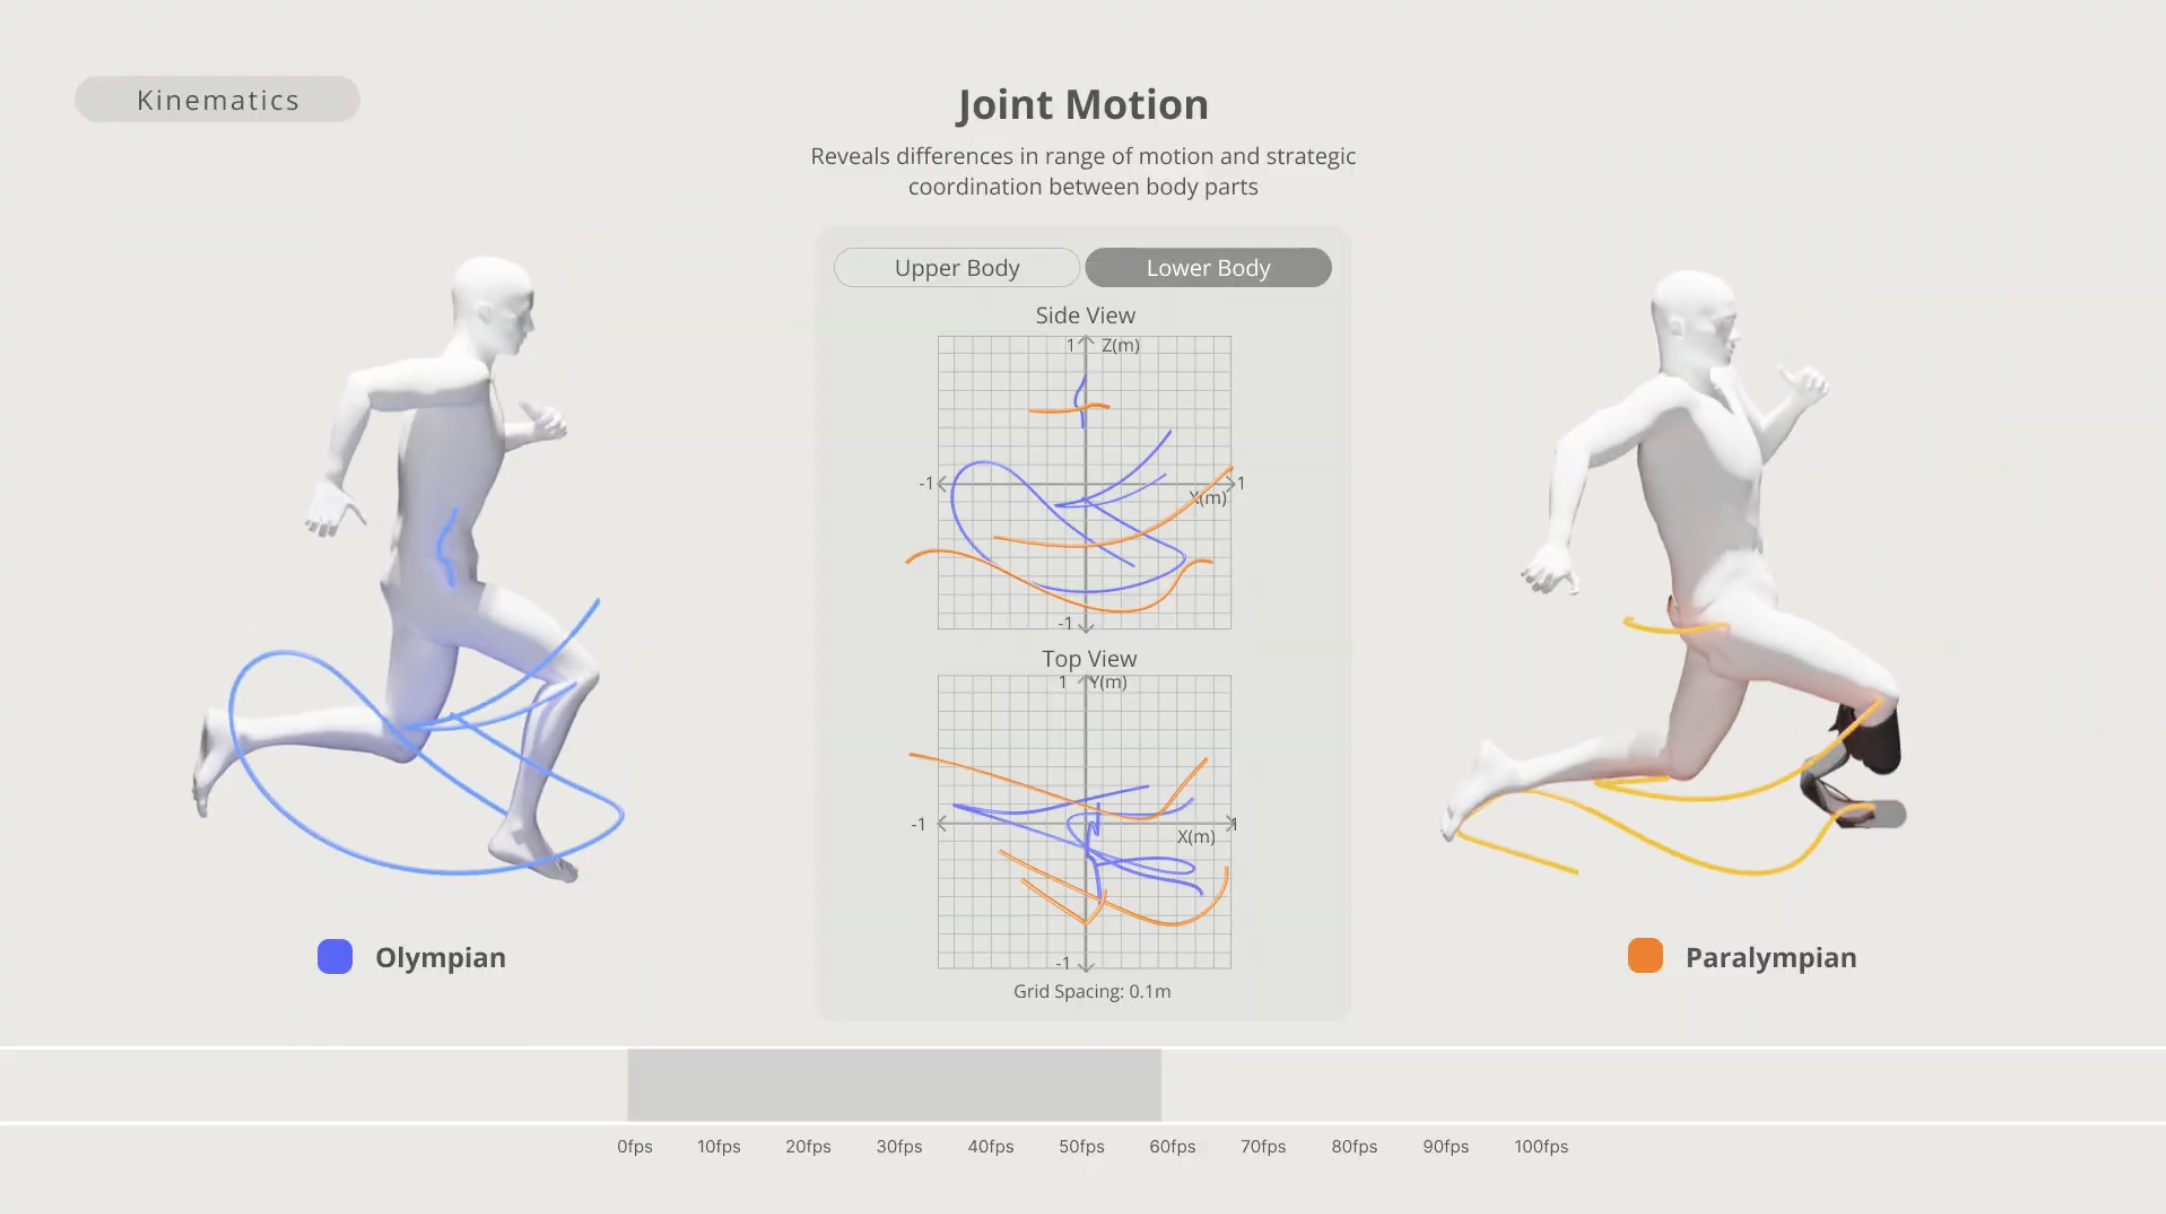
Explore Form: How do kinematic shapes of movement created by sprinting and jumping compare between Olympic and Paralympic athletes, and what does this reveal about the universality of human movement?
Explore Function: In what ways do biomechanics, such as the distribution of energy and force across different joints, differen tbetween Paralympians and Olympians, and how do these differences highlight the diversity of motion while pursuing the same goals?
Explore Performance: How do variations in movement relate to competitive outcomes and athletic performance. What does this suggest how we define athleticism?
Develop & Iterate
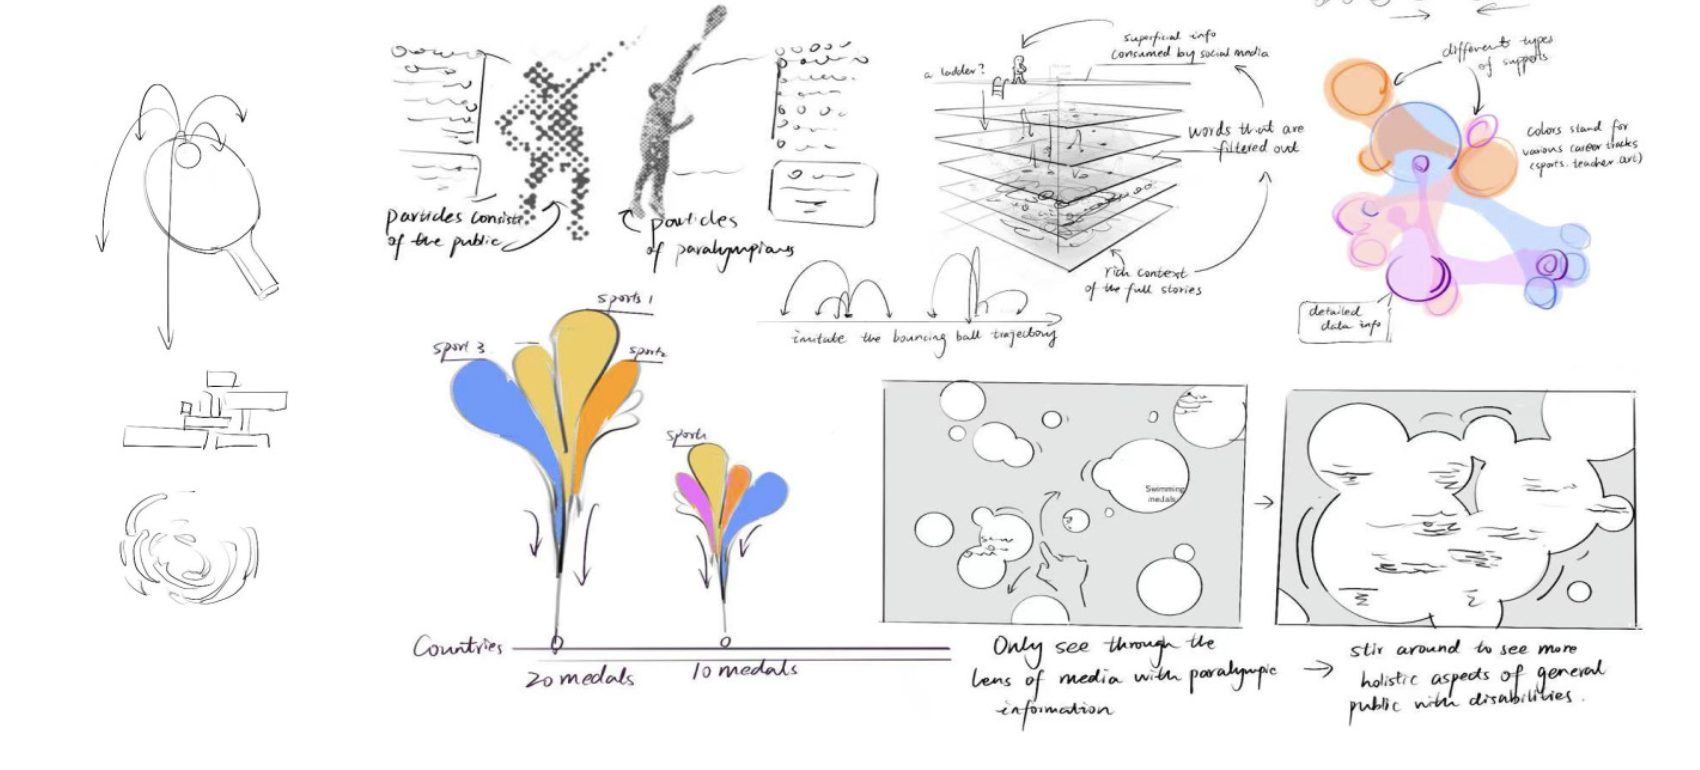
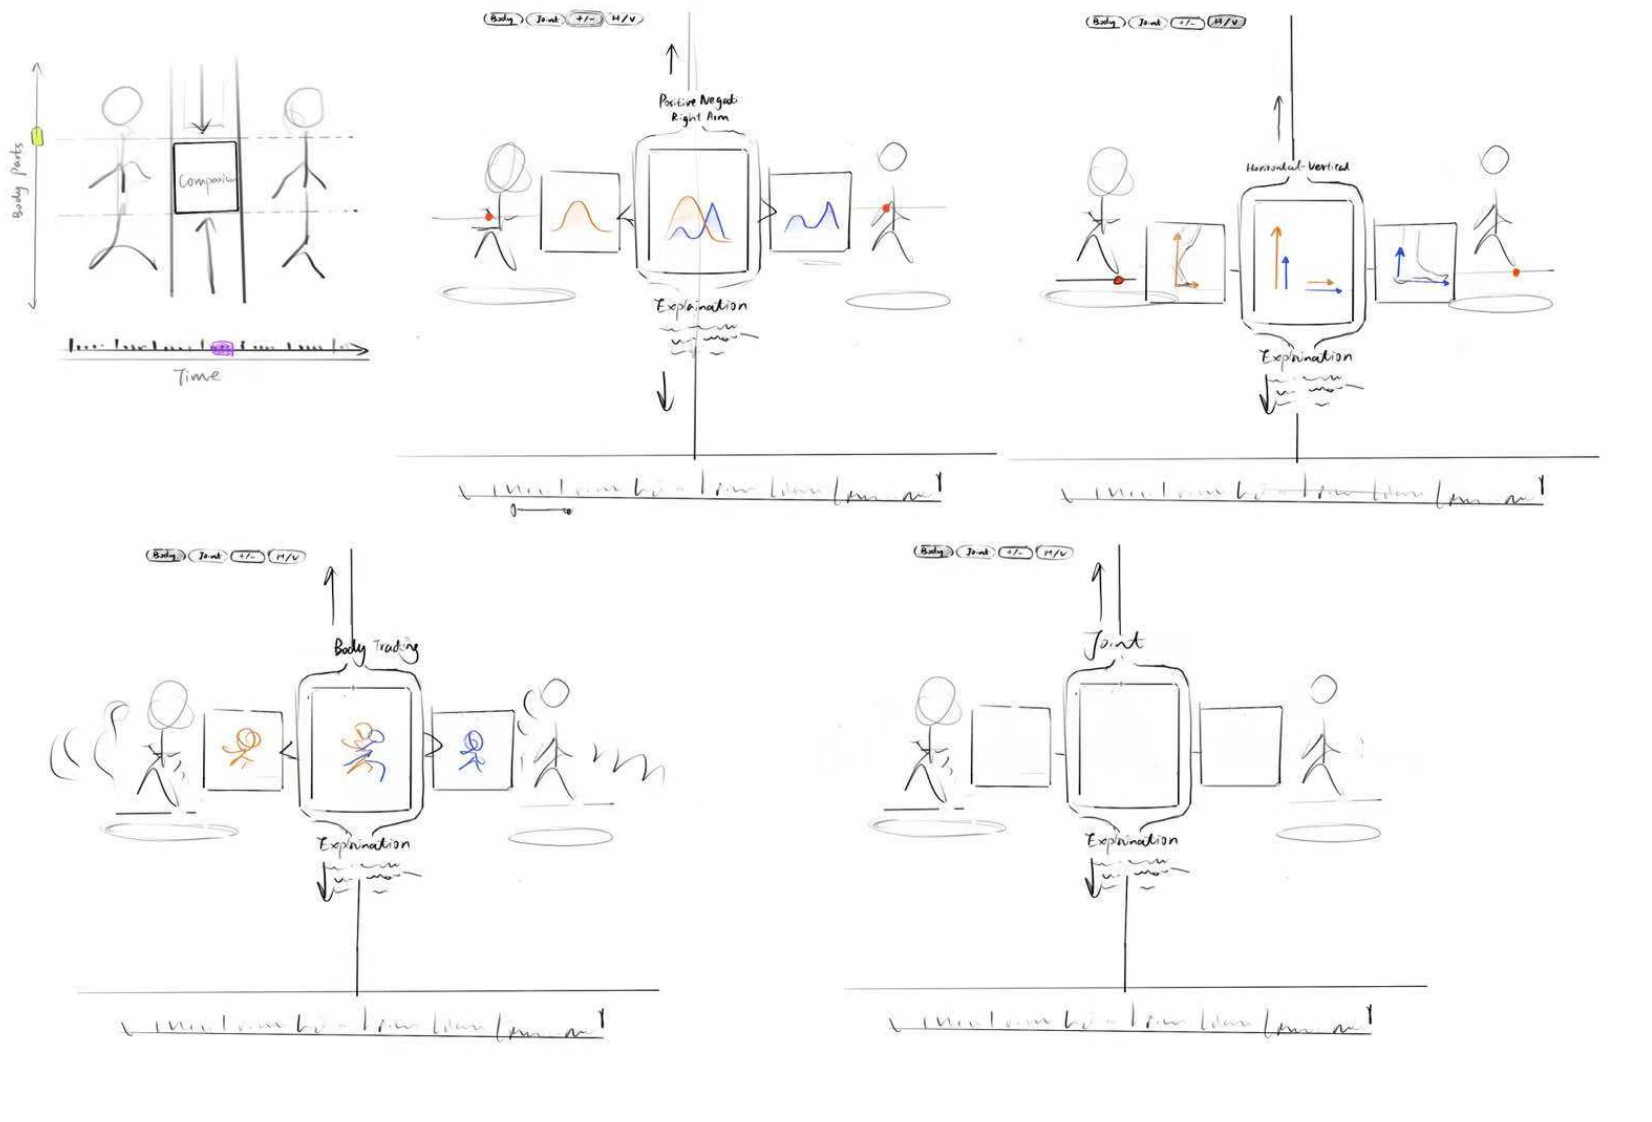
Early sketches included exploring broad range of ways we could communicate differences between elite athletes competing with and without prosthetics. At first, we were not sure if we were going to use the actual athletes’ movement or encode this through different shapes.
Sketching & Rapid Prototyping
Once we realized we wanted to focus on bringing together the biomechanics research data with actual footage (through 2D/3D models) to stay true to the athletes achievements, we experimented with the way in which we could portray this through a dashboard.
Through feedback sessions with our classmates and professors, we learned that our early dashboard prototypes were overwhelming for new viewers.
They found our visualizations in TouchDesigner and Blender along with our charts that visualized change in factors such as joint group energy across stance, the most compelling content. The rest felt “unnecessary.”
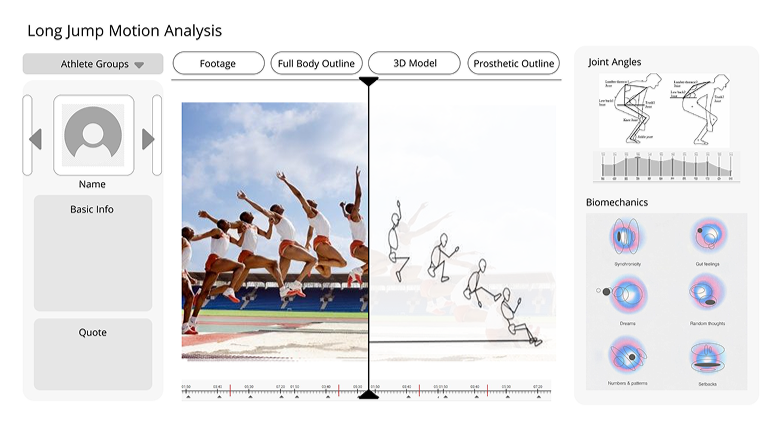
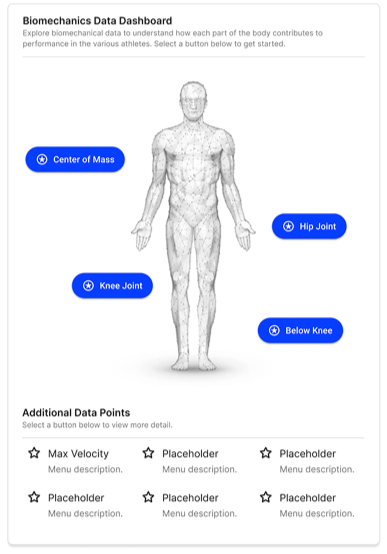
We returned to lo-fidelity wireframing and ultimately eliminated the complex dashboard UI to mitigate information overload. We also decided to bring back focus to just 2 selected long jumpers, Markus Rehm (Paralympian) and Miltiadis Tentoglou (Olympian), top athletes in the event.
For the biomechanics data, we decided to focus on solely joint energy, positive/negative work, and horizontal/vertical forces.
Once we validated this direction, we then began increasing fidelity and accuracy of our models as well as playing around with details like color. Through different iterations and informal testing with peers, we found that a white background was the most readable.
We selected a rich blue to represent the Olympian, as this color is often used to reflect standards in technology or stability. On the other hand, orange often symbolizes energy and creativity, which was fitting for the Paralympian’s ability to adapt in order to compete effectively.
Lastly, to ensure we did not lose the historical and cultural context behind today’s concept of the “standard” body and athleticism, we chose to expand our frames into a short visual film.
Using photography and text-based narration, the film introduces the systems that have shaped how we perceive bodies and movement over time.
It serves as the introduction for the data visualization, which then celebrates these athletes’ motion. Together, our goal was to prompt viewers to rethink how we value and interpret human movement.
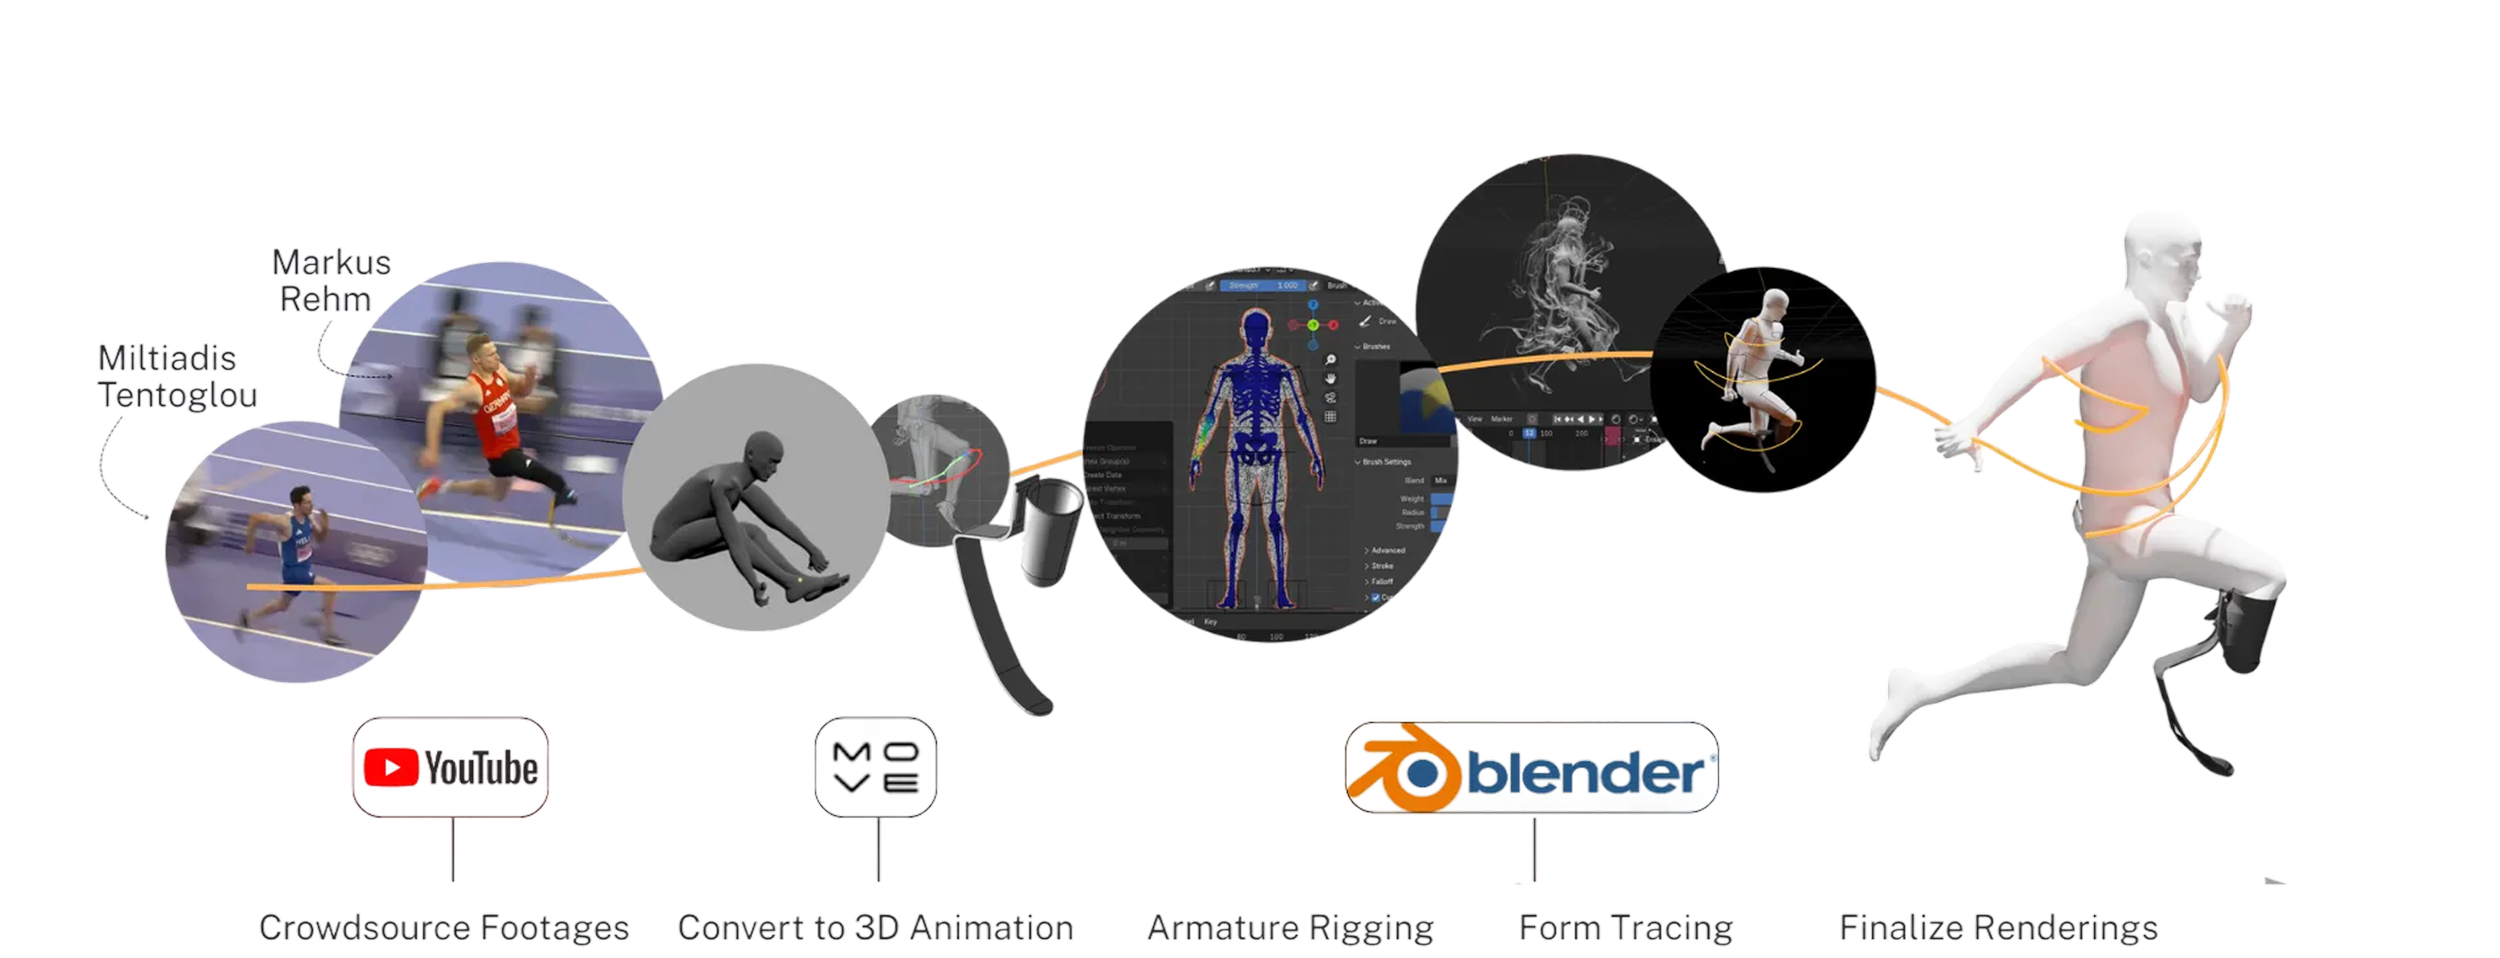
2D and 3D Model Production Workflow

Other Supplementary Tools
Delivery
By comparing Olympic and Paralympic long-jumpers’ movement in our short film, we investigate how diverse bodies perform beyond the limits of a standardized ideal. In visualizing these differences and common biomechanics, we seek to expand how movement and bodies are recognized and considered across not just sports, but also policy, design, and cultural narratives in the future.
Thesis
Final film can be found here (or scroll to top).
Insights we voiced over as the film played during final presentation can be found here.
Film
For our final presentation to design critics, we used the following deck to introduce and justify our data visualization. We received high remarks, with critics noting its potential as a noninvasive tool for analyzing movement, such as for future product development, training, and policy design for people living with disabilities.
They also recognized the depth of our workflow, which was very experimental and manual, suggesting that if we chose to continue the project (during our second-year thesis), we could scale it and fill in gaps with machine learning or by collecting our own motion-capture data.
Their feedback also opened other potential exciting avenues: What if athletes or even just people living with disabilities could upload their own videos and automatically receive annotated footage, biomechanical insights, and comparisons? Automating our worfklow could turn this visualization into a powerful, accessible tool for real-world application.
Presentation & Results
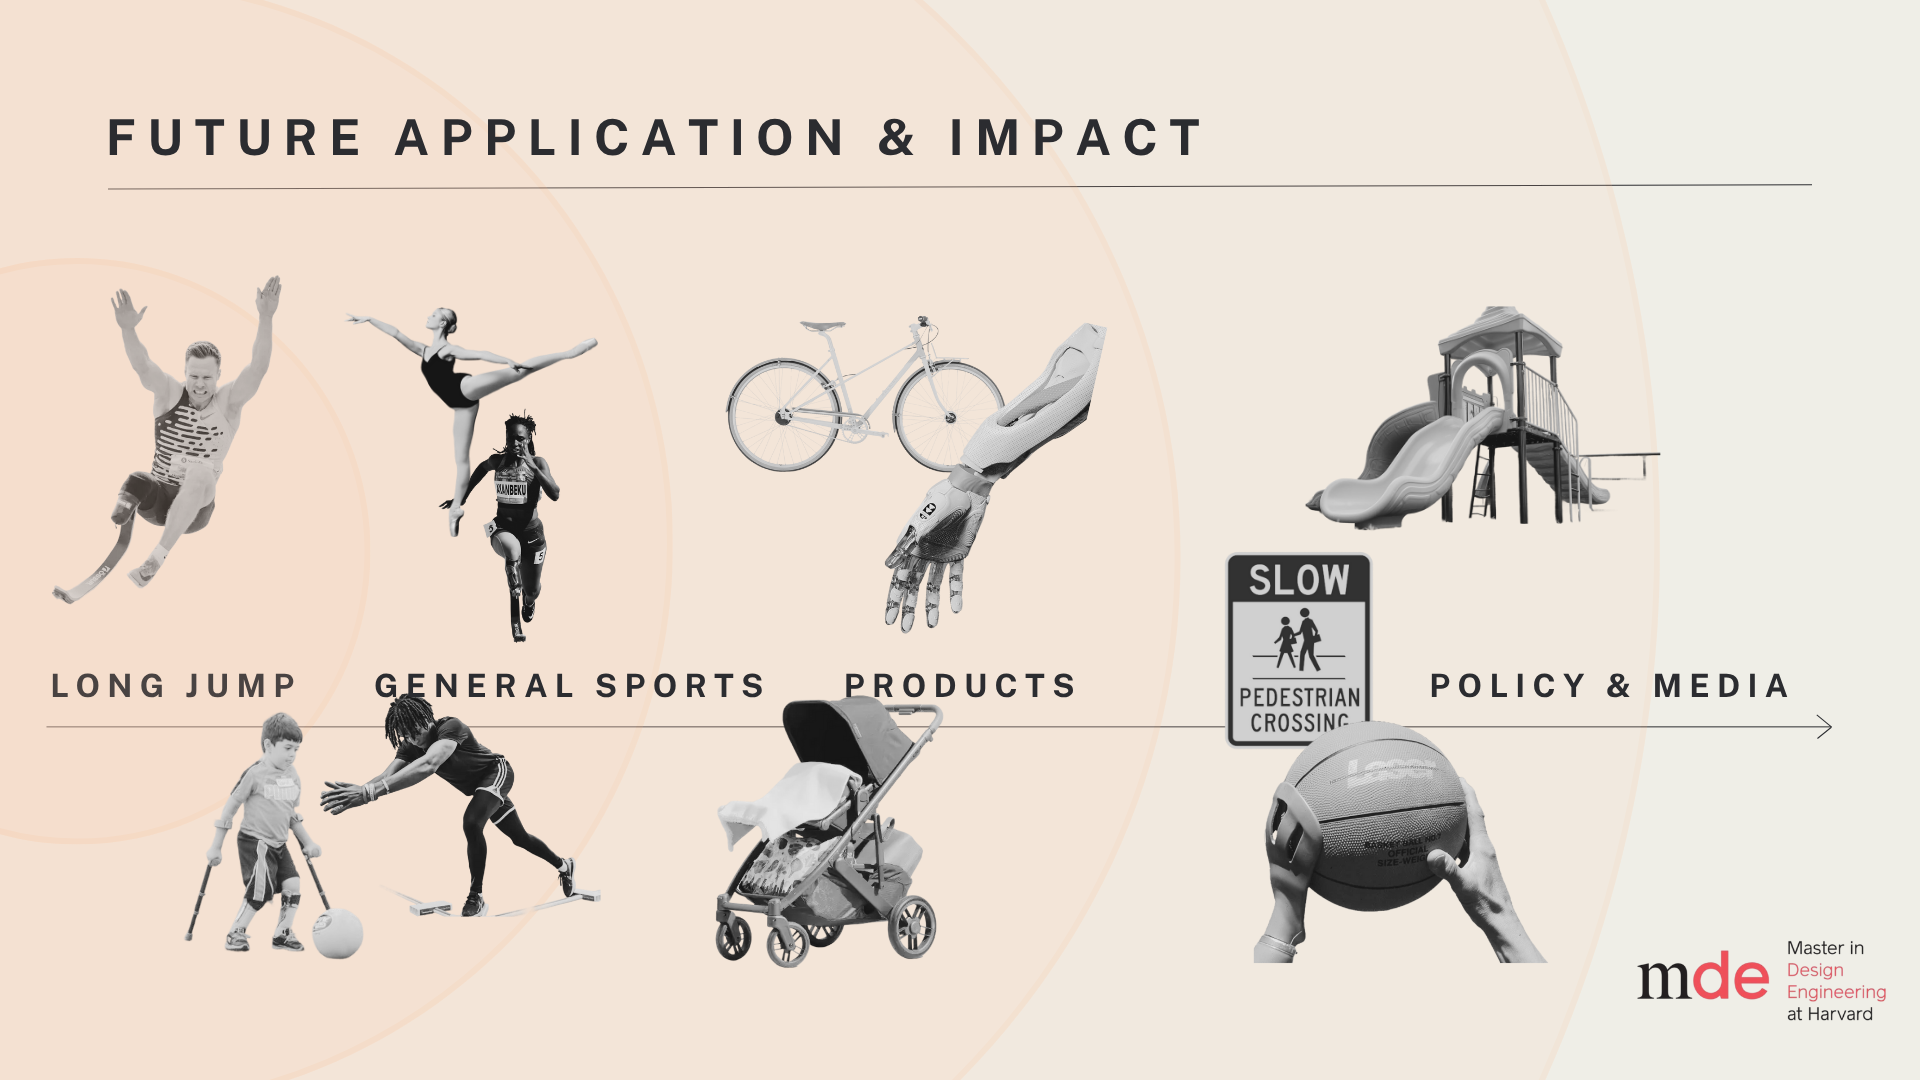


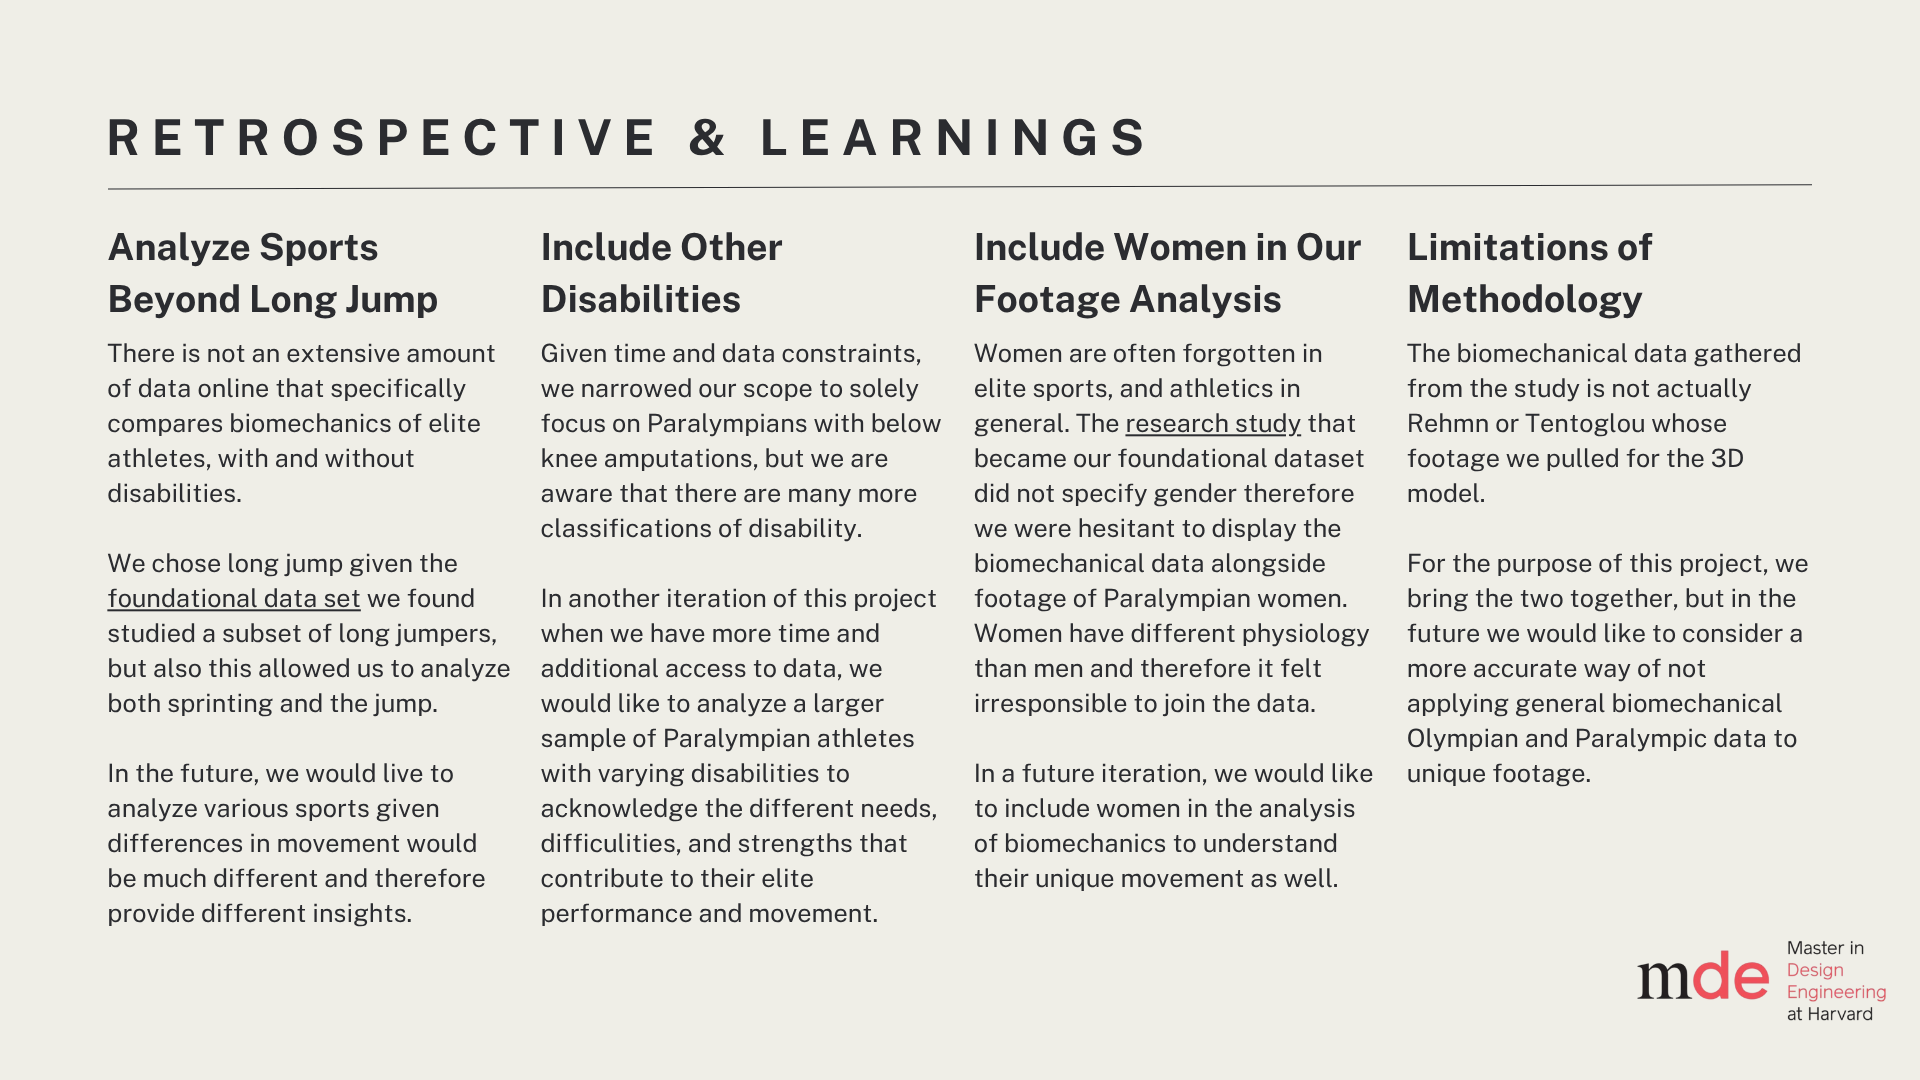
Analyze Sports Beyond Long Jump
There is not an extensive amount of data online that specifically compares biomechanics of elite athletes with and without disabilities. We chose long jump given the foundational data set we found studied a subset of long jumpers, but also this allowed us to analyze both sprinting and the jump.
In the future, we would live to analyze various sports given differences in movement would be much different and therefore provide different insights.
Include Other Disabilities
Given time and data constraints, we narrowed our scope to solely focus on Paralympians with below knee amputations, but we are aware that there are many more classifications of disability.
In another iteration of this project when we have more time and additional access to data, we would like to analyze a larger sample of Paralympian athletes with varying disabilities to acknowledge the different needs, difficulities, and strengths that contribute to their elite performance and movement.
Include Women in Our Footage Analysis
Women are often forgotten in elite sports, and athletics in general. The research study that became our foundational dataset did not specify gender therefore we were hesitant to display the biomechanical data alongside footage of Paralympian women. Women have different physiology than men and therefore it felt irresponsible to join the data.
In a future iteration, we would like to include women in the analysis of biomechanics to understand their unique movement as well.
Limitations of Methodology
The biomechanical data gathered from the study is not actually Rehmn or Tentoglou whose footage we pulled for the 3D model.
For the purpose of this project, we bring the two together, but in the future we would like to consider a more accurate way of not applying general biomechanical Olympian and Paralympic data to unique footage.